Transparency issues surrounding the Wichita public school district are in the news. There are steps that are easy to make, but the district resists.
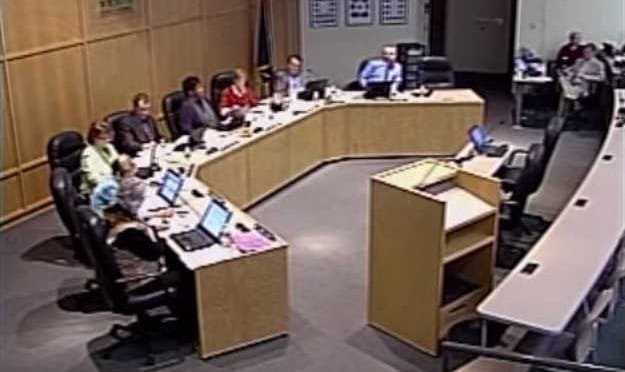
It’s difficult to view a meeting of the Wichita school board.
If you — perhaps a taxpayer to USD 259 — would like to watch a meeting of the board of USD 259, the Wichita public school district, your options are few. You can attend the meetings in person. Or, if you subscribe to certain cable television systems, you can view delayed repeats of the meetings. But that’s it.
Live and archived video of governmental meetings is commonplace, except for the Wichita public schools. Citizens must either attend USD 259 meetings or view delayed broadcasts on cable TV, if they subscribe.
There’s a simple way to fix this. It’s called YouTube.
When the Sedgwick County Commission was faced with an aging web infrastructure for its archived broadcasts, it did the sensible thing. It created a YouTube channel and uploaded video of its meetings. Now citizens can view commission meetings at any time on desktop PCs, tablets, and smartphones. This was an improvement over the old system, which was difficult to use and required special browser plug-ins.
Sometimes citizens have taken it upon themselves to post Wichita school board video on YouTube so that citizens and taxpayers may view meetings. Click for an example.The Wichita school district could do the same. In fact, the district already has a YouTube channel. Recently, it has started posting video excerpts of some meetings.
So the district has demonstrated it has the technical capability and resources to post video of meetings to YouTube. Now, in addition to the excerpts, it should post video of all meetings in their entirety.
Yes, it takes a long time to upload two or three hours of video to YouTube, but once started the process runs in the background without intervention. No one has to sit and watch the process.
I have asked the district why it does not make video of its meetings available online. The district responded that it “has a long-standing commitment to the USD 259 community of showing unabridged recordings of regular Board of Education meetings on Cox Cable Channel 20 and more recently AT&T U-verse Channel 99.”
Showing meetings delayed on cable TV is okay. It was innovative at one time — a long time ago. Okay. But why aren’t meetings shown live? What if you can’t watch the meeting before it disappears from the broadcast schedule after a week? What if you don’t subscribe to cable TV? (This is becoming more common as more people “cut the cord” and rely on services like YouTube for television.) What if you want to watch meetings on your computer, tablet, or smartphone?
I don’t think the fact that meetings are on cable TV means they can’t also be on YouTube. But that seems like what the school district believes.
Sometimes increasing transparency is so easy. We must wonder why governmental agencies resist.
Kansas school fund balances rose this year, in both absolute dollars and dollars per pupil.
As Kansans debate school funding, as the Kansas Supreme Court orders more school spending, and as schools insist that spending has been slashed, a fact remains: Kansas schools don’t spend all the money they’ve been given. Unspent fund balances grow in many years, and grew this year.
Fund balances are necessary for cash flow management. They buffer the flows of receipts and expenditures. The issue is what levels of balances are necessary, and, more importantly, how the balances change over years.
In Kansas, school districts report fund balances on July 1 of each year. Looking at fund balances on that date over time gives insight into how districts are managing receipts and expenditures. If a fund balance falls from July 1 of one year to July 1 of the next year, it means that the district spent more money from the fund than it put in the fund. The opposite is also true: If a balance rises, it means less was spent than was put in.
Based on recent data from the Kansas State Department of Education, fund balances rose rapidly after 2008, remained largely level from 2011 through 2015, and rose for 2016 and 2017.
For the school year ending in 2017, total fund balances were $2,016,863,070. (This value does not include non-school funds like museums and recreation center funds.) For 2016, the figure was $1,871,026,493. This is an increase of $145,836,577, or 7.8 percent.
Around half of these fund balances are in bond and capital funds, which are different from operating funds. Without these capital funds, balances rose from $935,116,567 to $970,188,922. This is an increase of $35,072,355, or 3.8 percent.
When fund balances rise, it is because schools did not spend all their revenue. If schools say that cuts had to be made, and at the same time fund balances are rising, Kansans might wonder why schools did not spend some of these idle fund balances.
I’ve gathered data about unspent Kansas school funds from Kansas State Department of Education and present it as an interactive visualization in a variety of tables and charts. Data is available for each district since 2008. You may explore the data yourself by using the visualization. Click here to open it in a new window. Data is from Kansas State Department of Education in current dollars (not adjusted for inflation). Visualization created using Tableau Public.
Top chart: Fund balances in all funds except non-school funds. Bottom: Without bond and capital funds. Click for larger.
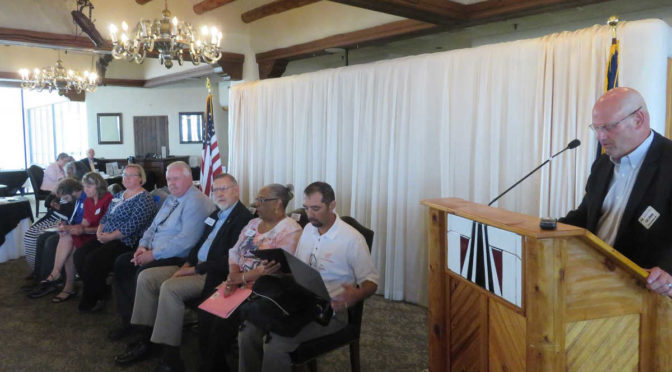
From the Wichita Pachyderm Club: A forum of candidates for Wichita school board. Recorded June 16, 2017.
At the lectern is Pachyderm Board Member Todd Johnson who moderated the forum.
Wichita school board candidates. Click for larger.The eight candidates in attendance were from left to right, Betty Arnold and Ben Blankley for District 1; Julie Hedrick and Trish Hileman for District 2; Mike Rodee for District 5; and Walt Chappell, Shirley Jefferson, and Ron Rosales for District 6.
All of these candidates plus two candidates who could not attend today’s forum will move forward to the November 7, 2017, General Election.
In school district elections, all qualified voters district-wide in the Wichita Public School District have the opportunity to vote for the candidate of their choice from all four Board of Education Districts in the November election.
In this episode of WichitaLiberty.TV: James Franko of Kansas Policy Institute joins Bob Weeks and Karl Peterjohn. Topics are the new Kansas school finance bill and the new tax bill. View below, or click here to view at YouTube. Episode 153, broadcast June 11, 2017.
A video explaining the Kansas budget is accurate in many aspects, but portrays a false and harmful myth regarding school spending.
A popular video explaining the Kansas budget deserves scrutiny for some of the data presented. The video is available at the Facebook page of Loud Light.
The presentation makes a few good points. For example, the video is correct in that the sales tax is a regressive tax, affecting low-income households in greater proportion. During the capaign for a Wichita city sales tax in 2014 I analyzed Census Bureau data and found that the lowest income class of families experience an increase nearly four times the magnitude as do the highest income families, as a percentage of after-tax income.12
The video also rightly notes that Kansas is now, and it has in the past under other legislatures and governors, inadequately funding KPERS, the state employee pension plan.
Interestingly, the video praises Kansas for its early adoption of “progressive economics.” I think the narrator meant “progressive taxation,” as the video shows Kansas adopting an income tax in 1933. How has that worked for Kansas? There are a variety of ways to look at the progress of Kansas compared to the nation, but here’s a startling fact: For the 73rd Congress (1933 to 1935) Kansas had seven members in the U.S. House of Representatives. (It had eight in the previous session.) Today Kansas has four members, and may be on the verge of losing one after the next census. This is an indication of the growth of Kansas in comparison to the nation.
Kansas Department of Transportation Funding, partial. Click for larger.The narrator states, “Kansas Department of Transportation is mostly funded by restricted revenue like fuel tax.” This was true at one time. But starting in 2011 KDOT has received more funding from sales tax than motor fuel tax.3 The gap is getting wider, as can be seen in the nearby chart. (By the way, there are proposals to increase the motor fuel tax. This tax is just like the sales tax, affecting low-income households greatest.)
School spending
The greatest problem in this video is its explanation of state spending on K through 12 schools. This is important, as the video correctly notes that this spending is half of the general fund budget. In introducing this section, the narrator notes “budget report gamesmanship that’s created a rhetorical paradox,” conceding it is “technically” true that education spending is at record levels.
The video then shows a chart titled “State Aid Per Pupil.” The chart starts with a value a little over $6,000 in 1993, declining to about $4,000 in 2013, then staying at that level. The citation is “Governor’s Budget Report” from the Kansas Division of Budget, and at the end of the video there is the explanation, “All financial data in this video is inflation adjusted to January 2017.”
A more accurate title for the chart is “Base State Aid Per Pupil.” That’s the actual name for the component of school spending that the video displays. This is important because base state aid is only the starting point for determining spending. Actual state aid to schools is much higher.
Kansas school spending, showing base state aid and total state aid. See article for notes about 2015. Click for larger.Base state aid per pupil — the statistic the video presents — is an important number.4 It’s the starting point for the Kansas school finance formula used before the 2015-2016 (fiscal 2016) school year, and something like it may be used in a new formula. 5
Base state aid, however, is not the only important number. To calculate the funding a school district receives, weightings are added. If students fall into certain categories, weightings for that category are added to determine a weighted enrollment. That is multiplied by base state aid to determine total state aid to the district. 6
While this may seem like a technical discussion that doesn’t make a difference, it’s very important. Some of the weightings are large and have increased by large amounts. The at-risk weighting, intended to cover the additional costs of teaching students from low-income families, started at five percent in 1993. In other words, for every student in this category, a school district received an extra five percent of base state aid. The value of this weighting has risen by a factor of nine, reaching 45.6 percent starting with the 2008-2009 school year.7
So in the nearby chart that I prepared using data adjusted for inflation in 2016, we see base state aid per pupil on a downward trend, just as the video shows. But I also plotted total state aid per pupil, which includes weightings. This number is on a mostly upward trend.
Kansas school spending, showing ratio of total state aid to base state aid. See article for notes about 2015. Click for larger.Kansas school spending. See article for notes about 2015. Click for larger.The weightings have a large effect on school funding. For example: During the 2004-2005 school year, base state aid was $3,863 and the at-risk weighting was ten percent. An at-risk student, therefore, generated $4,249 in state funding. (Other weightings might also apply.)
Ten years later base state aid was $3,852 — almost exactly the same — and the at-risk weighting was up to 45.6 percent. This generates funding of $5,609. For a district that qualified for the maximum high-density at-risk weighting, an additional $404 in funding was generated. (These numbers are not adjusted for inflation.)
So even though base state aid remained (almost) unchanged, funding targeted at certain students rose, and by a large amount.
Over time, values for the various weightings grew until by 2014 they added 85 percent to base state aid. A nearby chart shows the growth of total state aid as compared to base state aid. (Starting in fiscal 2015 the state changed the way local tax dollars are counted. That accounts for the large rise for the last year of data in the chart. For school years 2016 and 2017, block grants have replaced the funding formula, so base aid and weightings do not apply in the same way.)
All this determines state aid to schools only. There is also local aid and federal aid.
The questions Kansans should ask are these: Why doesn’t this video explain that “base state aid per pupil” is not the same as “state aid per pupil?” And why not explain that total state aid per pupil is much higher than base state aid, and has been rising over the long term?
For the fiscal 2016 and 2017 school years, the formula was replaced by block grants. ↩
Amendments to the 1992 School District Finance And Quality Performance Act and the 1992 School District Capital Improvements State Aid Program (Finance Formula Components), Kansas Legislative Research Department, May 20, 2014 http://ksde.org/Portals/0/School%20Finance/amends_to_sdfandqpa_2015.pdf↩
There’s also the high-density at-risk weighting. Starting with the 2006-2007 school year districts with a high concentration of at-risk students could receive an extra weighting of four percent or eight percent. Two years later the weightings were raised to six percent and ten percent. (This formula was revised again in 2012 in a way that may have slightly increased the weightings.) ↩
By Paul Waggoner. This column first appeared in the Hutchinson News.
Listening too often to Topeka politicians and administrators can leave a normal person feeling rather jaded, even used. Or maybe it’s the reporting, sometimes I just don’t know.
Such was the case Tuesday reading the News report of Kansas Dept of Education Deputy commissioner Dale Dennis speech to the local Rotary club (Hutchinson News, April 18, “Ed Official: Fund Gap numbers shocking”). His talk was filled with boilerplate and themes typical of the education establishment.
Mr. Dennis made multiple comparisons and statements of fact to prove his points. In the article by the News own Mary Clarkin, Mr. Dennis set up a paradigm of school under-funding by noting that “in 1992 base state aid per pupil was $3,600”, while now it is only $ 3,852. If the amount had just been adjusted for inflation “it would be $6001.12”. Those cheapskate legislators!
These disheartening numbers for funding over the last 25 years, Mr. Dennis told the crowd, “are shocking, shocking”. Then he went on to tout House Bill 2410 that would raise base state aid to $4,006 next year and $4,800 per pupil by 2021. The total cost of this bill would come to $750 million. Which, Ms. Clarkin summarizes, would get us “back to where the state should have been in 2015-16”’.
I am not an educator, but I am a business person and I am conversant with state budget and spending numbers. Mr. Dennis, I hope to show, should be embarrassed by his comments; but even more, the News should be embarrassed by their article.
The data on Kansas K-12 spending is easily accessible at the Kansas Dept of Education website ksde.org. Going back 20 years to Gov. Graves and 1997 you see total state funding of $1,815 million, rising to $3,950 million in 2016, a 117 percent increase! But the inflation rate during this period was only 47 percent, and the student count was up just three percent. Surprised?
Total spending (state/federal/local) is the best indicator of overall education financing. Plus you avoid disputes over how KPERS should be counted (whether state or local) and you get a genuine bottom dollar cost.
Many News readers need to let these numbers sink in. This is not spin, this is official data, Total spending went from $6,828 to $12,188 per pupil in barely 10 years.
Now Mr. Dennis was giving you a “fact” on base state aid, but he avoided telling our esteemed Rotarians that in the 1990s “base state aid” was 90 percent of the money Kansas provided our schools, but by 2005 it was only 65 percent of Kansas school funding, and in 2015 it was barely 50 percent. The ksde.org website listed over 25 different avenues state money now flows to local schools.
Ms. Clarkin of the News is an intelligent women and if some Department of Commerce representative came touting “shocking” job growth numbers in Kansas she surely would have noted evidence or context to the contrary. But Mr. Dennis utter factual inaccuracies go unchallenged.
Many seem to think it is “anti-education” to point out the real spending numbers. But to ignore the context of the 12 years prior to Brownback and the 80% increase in state K-12 spending is insane. Does any genuine public servant think that spending trajectory was sustainable?
The actual K-12 spending information is just a few clicks away from us for any school district or the state as a whole. The Rotarians of 2017 are a sensible group and will (I trust) rotate their minds with the actual data and judge accordingly.
But I, for one, am forever shocked (shocked!) by how disingenuous Topeka bureaucrats and our Kansas news media continue to be. And in that I expect I will have plenty of company as this legislative year moves forward.
Paul Waggoner is a Hutchinson resident and business owner. He can be reached with comments at waggonerpm@gmail.com.
Discussions of public policy need to start from a common base of facts and information. An episode shows that both our state government and news media are not helping.
A recent Hutchinson News article1 started with this:
Once you wake up to where Kansas was in 1992 at funding schools and what it needs to do to get caught up, said the Kansas Department of Education’s Deputy Commissioner Dale Dennis, it’s a shocker.
In 1992, base state aid per pupil was $3,600. That amount, taking into account the Consumer Price Index, would be the equivalent of $6,001.12 in 2013. Base state aid, however, has been frozen at $3,852 since 2014-15.
“The numbers are shocking, shocking,” Dennis told the Hutchinson Rotary Club at its Monday luncheon meeting at the Hutchinson Town Club.
Why is a speech by a government bureaucrat, as covered in a major newspaper, important? It illustrates two problems we face in understanding, discussing, and debating important matters of public policy.
First, can government be truthful and accurate? Dale Dennis — the state’s top official on school finance — certainly knows that the numbers he presented do not accurately characterize the totality of school spending in Kansas. But the problem is even worse than that. To use base state aid as the indicator of state spending on schools is deceptive. It’s deceptive in that, after adjusting for inflation, base state aid has declined. But total state aid to school districts has increased.
Base state aid is a false indicator of total spending on schools by the state. It’s fake — fake government. And for a newspaper to uncritically present this as news illustrates the second problem we face.
Background on base state aid and school spending
Kansas school spending, showing base state aid and total state aid. See article for notes about 2015. Click for larger.Base state aid per pupil — the statistic Dennis presented — is an important number.2 It’s the starting point for the Kansas school finance formula used before the 2015-2016 (fiscal 2016) school year, and something like it may be used in a new formula.3
Base state aid, however, is not the only important number. To calculate the funding a school district receives, weightings are added. If students fall into certain categories, weightings for that category are added to determine a weighted enrollment. That is multiplied by base state aid to determine total state aid to the district. 4
While this may seem like a technical discussion that doesn’t make a difference, it’s very important, because some of the weightings are large. The at-risk weighting, intended to cover the additional costs of teaching students from low-income families, started at five percent in 1993. In other words, for every student in this category, a school district received an extra five percent of base state aid. The value of this weighting has risen by a factor of nine, reaching 45.6 percent starting with the 2008-2009 school year.
There’s also the high-density at-risk weighting. Starting with the 2006-2007 school year districts with a high concentration of at-risk students could receive an extra weighting of four percent or eight percent. Two years later the weightings were raised to six percent and ten percent. (This formula was revised again in 2012 in a way that may have slightly increased the weightings.)
Kansas school spending, showing ratio of total state aid to base state aid. See article for notes about 2015. Click for larger.Kansas school spending. See article for notes about 2015. Click for larger.The weightings have a large effect on school funding. For example: During the 2004-2005 school year, base state aid was $3,863 and the at-risk weighting was ten percent. An at-risk student, therefore, generated $4,249 in state funding. (Other weightings might also apply.)
Ten years later base state aid was $3,852 — almost exactly the same — and the at-risk weighting was up to 45.6 percent. This generates funding of $5,609. For a district that qualified for the maximum high-density at-risk weighting, an additional $404 in funding was generated. (These numbers are not adjusted for inflation.)
So even though base state aid remained (almost) unchanged, funding targeted at certain students rose, and by a large amount.
Over time, values for the various weightings grew until by 2014 they added 85 percent to base state aid. A nearby chart shows the growth of total state aid as compared to base state aid. (Starting in fiscal 2015 the state changed the way local tax dollars are counted. That accounts for the large rise for the last year of data in the chart. For school years 2016 and 2017, block grants have replaced the funding formula, so base aid and weightings do not apply in the same way.)
What have we learned?
We’re left wondering a few things:
Did Deputy Superintendent Dale Dennis tell the audience that base state aid is just part of the school funding landscape, and not reflective of the big picture? Did he tell the audience that total state aid to schools has increased, and increased substantially? If so, why wasn’t it mentioned in the article?
If Dale Dennis did not tell the audience these things, what conclusions should we draw about his truthfulness?
Why didn’t the Hutchinson News article explain to readers that base state aid is not an accurate or total indicator of total state spending on schools?
What is the duty of reporters and editors? We’re told that experienced journalists add background and context to the news — things that the average reader may not know. (This article is designated as “Editor’s Pick” by the Hutchinson News.)
By the way, the Wichita Eagle, on its opinion page, cited in a positive and uncritical manner the Hutchinson News article.5 This is notable as the writer of the Eagle piece, opinion editor Phillip Brownlee, was a certified public accountant in a previous career. This is someone we should be able to trust to delve into numbers and tell us what they mean. But that isn’t the case.
Whatever your opinion on the level and trend of school spending, we need to start the discussion from a common base of facts and information. From this episode, we see that both our state government and news media are not helping.
For the fiscal 2016 and 2017 school years, the formula was replaced by block grants. ↩
AMENDMENTS TO THE 1992 SCHOOL DISTRICT FINANCE AND QUALITY PERFORMANCE ACT AND THE 1992 SCHOOL DISTRICT CAPITAL IMPROVEMENTS STATE AID PROGRAM (FINANCE FORMULA COMPONENTS), Kansas Legislative Research Department, May 20, 2014 http://ksde.org/Portals/0/School%20Finance/amends_to_sdfandqpa_2015.pdf↩
A public opinion poll asks whether Kansans are concerned about school spending, but leaves us wondering why they are concerned.
A public opinion poll commissioned by Kansas Center for Economic Growth asks questions so vague that the results could be interpreted in many ways.
The March 30, 2017 press release on the poll announced: “Nearly all Kansas voters are worried the state is not investing enough public education. Eighty-five percent of Kansas voters feel concerned about the state’s level of spending on public education.”1
“Q.5 Would you say you are very concerned, somewhat concerned, a little concerned, or not at all concerned about the state’s level of spending on public education?”
(The reported results are: Very concerned 63%, Somewhat concerned 20%, A little concerned 5%, Not at all concerned 8%, (Don’t know/refused) 3%)
Let me ask you: Are you concerned about the level of spending on public education? I am. And there might be many reasons why Kansans are concerned.
Some people think the state spends too much
Some people think the state spends too little
Many people know that school spending is a large portion of the state’s budget, so naturally they are concerned, no matter if their opinion is that spending is too high or too low
Some people are concerned that state spending is misdirected and inefficient
There could be other reasons why people are concerned about the level of state spending on education. But this question does not give any guidance as to why people are concerned.
Later in the survey another question was asked: “Q.12 As you may know, the Kansas Supreme Court recently ruled, unanimously, that the state’s spending on public education was unconstitutionally low and needed to be fixed by June 30th. With this in mind, would you say you are very concerned, somewhat concerned, a little concerned, or not at all concerned about the state’s level of spending on public education?”
Still, the question did not ask whether people are concerned because spending is too high or too low. As a result, the answers to the survey questions can be used to advance nearly any agenda.
Despite years of purported budget cuts, the Wichita public school district has been able to improve or maintain student/teacher ratios.
When discussing school funding, there is controversy over how spending should be measured. What funds are included? Is KPERS included? Should we adjust for enrollment and inflation? What about bond and interest funds and capital outlay?
The largest expenditures of schools — some 80 percent nationwide — is personnel costs. In Kansas, and Wichita in particular, we’re told that budget cuts are causing school class sizes to increase.
When we look at numbers, we see that the Wichita school district has — over the long term — been able to maintain or reduce its student/teacher ratios. (Student/teacher ratio is not the same statistic as class size.) There have been a few ups and downs along the way, but for all three school levels, the ratios are lower or nearly the same than they were ten years ago. (Click charts for larger versions.)
This means that Wichita schools have been able to increase employment of teachers at a faster rate than enrollment has risen.
So however spending is categorized in funds, whether KPERS contributions are included or not, whether the funding comes from state or local sources, whether spending is adjusted for inflation, the Wichita school district has been able to improve or maintain its student/teacher ratios.
Data is from USD 259 Comprehensive Annual Financial Report for 2016, Miscellaneous Statistics, page 118, and CAFR from other years.