Tag: Education

  • WichitaLiberty Podcast, episode 2

    Voice for Liberty logo with microphone 150In this episode of WichitaLiberty Podcasts: David Boaz, Executive Vice President of the Cato Institute, visits the WichitaLiberty.TV studios and explains the ideas behind libertarianism and its approach to government and society. New figures from the Kansas State Department of Education show that spending on public schools in Kansas is rising, and at a rate higher than the year before. Is Wichita economic development being managed? The problem of overcriminalization. City of Wichita proves Einstein’s definition of insanity. Episode 2, October 25, 2013.

    [powerpress]

    Shownotes

    WichitaLiberty.TV October 27, 2013. David Boaz, Executive Vice President of the Cato Institute, visits the WichitaLiberty.TV studios and explains the ideas behind libertarianism and its approach to government and society.
    Kansas school spending rises
    Wichita economic development not being managed
    USA versus You: The problem of overcriminalization
    City of Wichita proves Einstein’s definition of insanity

  • Kansas school spending holding steady

    (This article has been revised to reflect a data entry error.)

    New figures from the Kansas State Department of Education show that spending on public schools in Kansas is rising in actual dollars, and holding steady in inflation-adjusted dollars.

    The nearby table presents Kansas school spending figures for recent years. Figures are adjusted for inflation by the consumer price index (CPI), using 2013 as the base year. Charts appear at the end of this article.

    kansas-school-spending-2013-10-table-01

    Note that base state aid per pupil, adjusted for inflation, is lower than it was during the previous decade. Total Kansas state spending on schools, however, has recovered to the same level as 2007.

    Total state aid per pupil this past school year was $6,984. Base state aid per pupil was $3,838. Total state spending, therefore, was 1.82 times base state aid.

    It’s important to consider the totality of spending and not just base state aid. It’s important because total spending is so much greater than base state aid. Also, total spending accounts for some of the difficulties and expenses that schools cite when asking for higher spending.

    For example, advocates for higher school spending often point to non-English speaking students and at-risk students as being expensive to educate. In recognition of this, the Kansas school finance formula makes allowances for this. According to the Kansas Legislator Briefing Book for 2013, the weighting for “full-time equivalent enrollment in bilingual education programs” is 0.395. This means that for each such student a school district has, an additional 39.5 percent over base state aid is given to the district.

    For at-risk pupils, the weighting is 0.456. At risk students, according to the briefing book, “are determined on the basis of at-risk factors determined by the school district board of education and not by virtue of eligibility for free meals.”

    Taken together, bilingual students considered to be at-risk generate an additional 85.1 percent of base state aid to be sent to the district, per student.

    Base state aid should not be focus

    The decline in base state aid per pupil is a convenient fact for public school spending boosters. They can use a statistic that contains a grain of truth in order to whip up concern over inadequate school spending. They can cite this as an argument for increasing spending, even though spending has been rising.

    (By the way, when citizens in Kansas and across the nation are asked questions about school spending, we learn they are totally uninformed. Even worse, several recent candidates for the Wichita school board were similarly uninformed. See Wichita school board candidates on spending.)

    Further, citing only base state aid reduces “sticker shock.” Most people are surprised to learn that our schools spend $12,781 per student. It’s much easier to tell taxpayers that only $3,838 was spent. But that’s not a complete picture, not by far.

    Also, it’s important to realize that the nature of Kansas school funding has changed in a way that makes base state aid per pupil less important as a measure of school spending. See Base state aid is wrong focus for Kansas school spending.

    kansas-school-spending-per-student-2013-10-chart-01

    kansas-school-spending-per-student-2013-10-chart-02-bsapp

  • Kansas schools do not have rigorous standards, despite newspaper editorials

    kansas-city-star-2013-10-15A Kansas City Star editorial makes a case for higher school spending in Kansas, but is based on a premise that doesn’t exist in fact.

    In its conclusion, the editorial states: “Kansans have always known that rigorous standards and strong, well-funded public school systems are the best routes to an educated work force.” (A decisive time for Kansas schools, October 15, 2013.)

    The problem is that Kansas doesn’t have rigorous standards for its schools.

    If the Star editorial writers had asked the National Center for Education Statistics about Kansas school standards, that agency might have referred the editorialists to the most recent version of Mapping State Proficiency Standards Onto the NAEP Scales. (NCES is the primary federal entity for collecting and analyzing data related to education in the U.S. and other nations, and is located within the U.S. Department of Education and the Institute of Education Sciences.)

    The mapping project establishes a relationship between the tests each state gives to assess its students and the National Assessment of Education Progress, a test that is the same in all states. The conclusion of NCES is that Kansas school standards are relatively low, compared to other states. This video explains. (View below, or click here to view in HD at YouTube.)

    For Kansas, here are some key findings. First, NCES asks this question: “How do Kansas’s NAEP scale equivalent scores of reading standards for proficient performance at grades 4 and 8 in 2009 compare with those estimated for 2005 and 2007?”

    For Kansas, the two answers are this (emphasis added):

    “Although no substantive changes in the reading assessments from 2007 to 2009 were indicated by the state, the NAEP scale equivalent of both its grade 4 and grade 8 standards decreased.

    Also: “Kansas made substantive changes to its reading grade 8 assessment between 2005 and 2009, and the NAEP scale equivalent of its grade 8 standards decreased.

    In other words, NCES judged that Kansas weakened its standards for reading performance.

    A similar question was considered for math: “How do Kansas’s NAEP scale equivalent scores of mathematics standards for proficient performance at grades 4 and 8 in 2009 compare with those estimated for 2005 and 2007?”

    For Kansas, the two answers are this (emphasis added):

    “Although no substantive changes in the mathematics assessments from 2007 to 2009 were indicated by the state, the NAEP scale equivalent of its grade 8 standards decreased (the NAEP scale equivalent of its grade 4 standards did not change).”

    Also: “Kansas made substantive changes to its mathematics grade 4 assessment between 2005 and 2009, but the NAEP scale equivalent of its grade 4 standards did not change.”

    For mathematics, NCES judges that some standards were weakened, and some did not change.

    In its summary of Kansas reading standards, NCES concluded: “In both grades, Kansas state assessment results showed more positive changes in achievement than NAEP results.” For mathematics, the summary reads: “In grade 4, Kansas state assessment results showed a change in achievement that is not different from that based on NAEP results. In grade 8, state assessment results showed a more positive change.”

    In other words: In three of four instances, Kansas is claiming positive student achievement that isn’t apparent on national tests.

    Kansas is not alone in weakening its standards during this period. It’s also not alone in showing better performance on state tests than on national tests. States were under pressure to show increased scores, and some — Kansas included — weakened their state assessment standards in response.

    What’s important to know is that Kansas school leaders are not being honest with Kansans as a whole, and with parents specifically. In the face of these findings from NCES, Kansas Commissioner of Education Diane M. DeBacker wrote this in the pages of The Wichita Eagle: “Kansans are proud of the quality of their public schools, and a steady and continuing increase in student performance over the past decade has given us ample reason for that pride.” (Diane DeBacker : Pride in Kansas public schools is well-placed, March 20, 2012.)

    A look at the scores, however, show that national test results don’t match the state-controlled tests that DeBacker touts. She controls these states tests, by the way. See Kansas needs truth about schools.

    The same year a number of school district superintendents made a plea for increased funding in Kansas schools, referring to “multiple funding cuts.” (Reverse funding cuts, May 3, 2012 Wichita Eagle.) In this article, the school leaders claimed “Historically, our state has had high-performing schools, which make Kansas a great place to live, raise a family and run a business.”

    These claims made by Kansas school leaders are refuted by the statistics that aren’t under the control of these same leaders. Before courts rule on school spending, and before we change Kansas school standards, we need to realize the recent stewardship of Kansas schools under current leadership.

    Ask these questions before devoting more resources to Kansas public schools:

    Why are Kansas school standards so low compared to other states?

    Why did Kansas reduce its standards at the same time school spending was increasing?

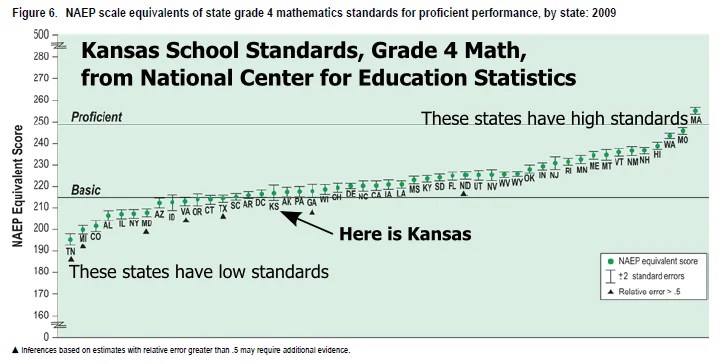
    Following are two examples of charts from the NCES study where Kansas school standards rank compared to other states. Click on them for larger versions.

    Kansas Grade 4 Reading Standards

    Kansas Grade 4 Math Standards 01

  • Kansas should let markets regulate schools

    School blackboardWhen markets are not allowed to work, we waste energy fighting over laws and volumes of regulations.

    Earlier this year the Wichita Eagle made a state-wide issue (literally) out of something that could self-regulate, if only we would let it.

    The issue is what proportion of Kansas school spending finds its way “into the classroom” — whatever that means — and Kansas Governor Sam Brownback’s use of this statistic.

    The front page Sunday article (Governor’s numbers come under question) spent over 1,000 words on the topic. It covers where Brownback got the number he uses, the controversy over how to classify spending as “classroom” or other, and troubles surrounding an advocacy group that pushed for more spending going to the classroom.

    Why is this issue important? In Kansas, most children attend government schools that are funded and regulated by government. This means that how schools spend money is a political issue. There will be arguments.

    In the private sector, however, we don’t see these types of arguments. Do we argue in public about how much the grocery store spends on administrative overhead compared to other spending? Of course not. The managers and owners of the grocery store are intensely interested in this issue. The public is too, but only in how the management of the grocery store affects their shopping experience.

    If shoppers don’t like the way a store is managed, they shop somewhere else. Management may notice this and make changes that customers appreciate. If management doesn’t adapt, the store will likely close and be replaced by other stores that do a better job delivering what customers want.

    Or, some shoppers may like a high level of management in a grocery store — one with more personal service. Some like a bare-bones store where you sack your groceries yourself. This variation in customer tastes and needs leads to what we observe: Broad diversity in the types of grocery stores shoppers can choose from.

    The point is that in the private sector, people get to choose what they like. They choose what’s best for them. But with our system of public schools funded and regulated by government, there is no choice. (Yes, you can escape the public schools and use others, but you still must pay for the government schools, and many families can’t afford to pay for both.)

    There’s a factor that leads to this diversity of grocery stores and self-regulation focused on meeting consumers’ needs. It’s market competition.

    But Kansas has no market competition in schools, unless you want to escape the system entirely and still pay for it. We have a very weak charter school law, meaning there are very few charter schools in Kansas. We have no vouchers or tax credit scholarships.

    If we had these instruments of school choice in Kansas, government schools would face market competition. They would have to start being responsive to customers. We could allow schools to decide for themselves how much to spend on management and things other than the classroom. Market competition would guide schools in structuring their management and budgets to best meet the needs of schoolchildren and parents.

    If we had school choice in Kansas, we would have a more diverse slate of schools for parents to select from. We could rely on the nature of markets to self-regulate schools like we rely on markets to regulate grocery stores.

    We could quit arguing about things like how much is spent in the classroom, and we could actually focus on teaching children.

    But the Kansas school education establishment doesn’t want that. That establishment fights every attempt to introduce even small elements of choice into Kansas.

  • A learning opportunity for Wichita

    Next month the Wichita Metro Chamber of Commerce brings a speaker to town who might be able to offer Wichita helpful advice. As reported in the Wichita Business Journal, “Jim Clifton, the chairman and CEO of Gallup Inc., says cities that create a culture of entrepreneurial development are the ones succeeding today.”

    Clifton is the author of The Coming Jobs War. Here’s material from the inside flap of this 2011 book:

    WHAT EVERYONE IN THE WORLD WANTS IS A GOOD JOB

    In a provocative book for business and government leaders, Gallup Chairman Jim Clifton describes how this undeniable fact will affect all leadership decisions as countries wage war to produce the best jobs.

    Leaders of countries and cities, Clifton says, should focus on creating good jobs because as jobs go, so does the fate of nations. Jobs bring prosperity, peace, and human development — but long-term unemployment ruins lives, cities, and countries.

    Creating good jobs is tough, and many leaders are doing many things wrong. They’re undercutting entrepreneurs instead of cultivating them. They’re running companies with depressed workforces. They’re letting the next generation of job creators rot in bad schools.

    A global jobs war is coming, and there’s no time to waste. Cities are crumbling for lack of good jobs. Nations are in revolt because their people can’t get good jobs. The cities and countries that act first — that focus everything they have on creating good jobs — are the ones that will win.

    visioineering-wichita-video-thumbnail

    It sounds like Clifton has some good advice that Wichita could follow in two areas: Fostering entrepreneurship and improving schools. Wichita certainly needs help in creating jobs. In the nearby video, the record of job growth for Wichita, the nation, and our Visioneering peers (Kansas City, Omaha, Oklahoma City, and Tulsa) is presented. (Click here to watch the video on YouTube, which may work best.) If you don’t have time to watch, I’ll let you know that Wichita performs badly in this comparison. In last place, that is.

    why-kansas-school-standards-low-video

    Regarding schools, the record of Kansas schools is not as good as it first appears if we look beyond a simple comparison of NAEP scores with other states. As shown in Kansas school test scores, a hidden story, Kansas trails Texas in most areas of comparison. Further, the National Center for Education Statistics, in the most recent version of Mapping State Proficiency Standards Onto the NAEP Scales, found that Kansas had weakened some of its standards. NCES judged Kansas’ standards as being low to begin with, and then they were lowered farther. This was during the years immediately after the Kansas Supreme Court ordered higher school spending, and while the legislature complied with that order. See Why are Kansas school standards so low?

    But our government leaders in Wichita and Kansas won’t recognize these facts, at least not publicly.

    Entrepreneurship in Wichita

    Wichita’s economic development policies are definitely stacked against the entrepreneur. As Wichita props up its established industries, it makes it more difficult for young firms to thrive. Wichita uses programs that are targeted investment in our economic future, our elected officials and bureaucrats believing that they have the ability to select which companies are worthy of public investment, and which are not. It’s a form of centralized planning by the state that shapes the future direction of the Wichita and Kansas economy.

    These targeted economic development efforts fail for several reasons. First is the knowledge problem, in that government simply does not know which companies are worthy of public investment. This lack of knowledge, however, does not stop governments from creating policies for the awarding of incentives. This “active investor” approach to economic development is what has led to companies receiving grants or escaping hundreds of millions in taxes — taxes that others have to pay. That has a harmful effect on other business, both existing and those that wish to form.

    Embracing Dynamism: The Next Phase in Kansas Economic Development Policy

    Professor Art Hall of the Center for Applied Economics at the Kansas University School of Business is critical of this approach to economic development. In his paper Embracing Dynamism: The Next Phase in Kansas Economic Development Policy, Hall quotes Alan Peters and Peter Fisher: “The most fundamental problem is that many public officials appear to believe that they can influence the course of their state and local economies through incentives and subsidies to a degree far beyond anything supported by even the most optimistic evidence. We need to begin by lowering expectations about their ability to micro-manage economic growth and making the case for a more sensible view of the role of government — providing foundations for growth through sound fiscal practices, quality public infrastructure, and good education systems — and then letting the economy take care of itself.”

    In the same paper, Hall writes this regarding “benchmarking” — the bidding wars for large employers: “Kansas can break out of the benchmarking race by developing a strategy built on embracing dynamism. Such a strategy, far from losing opportunity, can distinguish itself by building unique capabilities that create a different mix of value that can enhance the probability of long-term economic success through enhanced opportunity. Embracing dynamism can change how Kansas plays the game.”

    In making his argument, Hall cites research on the futility of chasing large employers as an economic development strategy: “Large-employer businesses have no measurable net economic effect on local economies when properly measured. To quote from the most comprehensive study: ‘The primary finding is that the location of a large firm has no measurable net economic effect on local economies when the entire dynamic of location effects is taken into account. Thus, the siting of large firms that are the target of aggressive recruitment efforts fails to create positive private sector gains and likely does not generate significant public revenue gains either.’”

    (For a summary of the peer-reviewed academic research that examines the local impact of targeted tax incentives from an empirical point of view, see Research on economic development incentives. A sample finding is “General fiscal policy found to be mildly effective, while targeted incentives reduced economic performance (as measured by per capita income).”

    There is also substantial research that is it young firms — distinguished from small business in general — that are the engine of economic growth for the future. We can’t detect which of the young firms will blossom into major success — or even small-scale successes. The only way to nurture them is through economic policies that all companies can benefit from. Reducing tax rates for everyone is an example of such a policy. Abating taxes for specific companies through programs like IRB, EDX, PEAK, and HPIP are examples of precisely the wrong policy.

    In explaining the importance of dynamism, Hall wrote: ” Generally speaking, dynamism represents persistent, annual change in about one-third of Kansas jobs. Job creation may be a key goal of economic development policy but job creation is a residual economic outcome of business dynamism. The policy challenge centers on promoting dynamism by establishing a business environment that induces business birth and expansion without bias related to the size or type of business.”

    We need to move away from economic development based on this active investor approach, especially the policies that prop up our established companies to the detriment of dynamism. We need to advocate for policies — at Wichita City Hall, at the Sedgwick County Commission, and at the Kansas Statehouse — that lead to sustainable economic development. We need political leaders who have the wisdom to realize this, and the courage to act appropriately. Which is to say, to not act in most circumstances.

  • Kansas school employment trends

    SchoolListening to Kansas school officials and some legislators, you’d think that Kansas schools had very few teachers left, and that students were struggling in huge classes. But statistics show that school employment has rebounded, both in terms of absolute numbers of teachers and certified employees, and also in the ratios of students to these employees. The following video explains. (Click here to view in high definition at YouTube.)

    The story is not the same in every district. But considering the entire state, two trends emerge. For the past two years, the number of teachers employed in Kansas public schools has risen. Correspondingly, the student-teacher ratio has fallen. The trend for certified employees is a year behind that of teachers, but for the last year, the number of certified employees has risen, and the ratio to pupils has fallen.

    Kansas school employment

    It’s little wonder that Kansas government school spending defenders focus on school funding. If they were to talk about Kansas school performance, they’d have to confront two unpleasant realities. First, Kansas has set low standards for its schools, compared to other states. Then, when the Kansas Supreme Court ordered more spending in 2005, the state responded by lowering school standards further. Kansas school superintendents defend these standards.

    Kansas school employment ratios

    I’ve created interactive visualizations that let you examine the employment levels and ratios in Kansas school districts. I’ve created interactive visualizations that let you examine the employment levels and ratios in Kansas school districts. Click here for the visualization of employment levels. Click here for the visualization of ratios (pupil-teacher and pupil-certified employee). Data is from Kansas State Department of Education. Visualization created by myself using Tableau Public.

  • Kansas school test scores, a hidden story

    School blackboardWe hear a lot about how Kansas shouldn’t strive to become more like Texas, especially regarding schools. Defenders of high school spending in Kansas portray Texas as a backwater state with poor schools. This video takes a look at Kansas and Texas school test scores and reveals something that might surprise you. (Click here to view in high definition at YouTube.) Narrative explanation follows.

    Superficially, it looks like the Kansas school spending establishment has a valid point. Scores on the National Assessment of Education Progress, a test that is the same in all states, has Kansas scoring better than Texas (with one tie) in reading and math, in both fourth and eighth grade.

    That makes sense to the school spending establishment, as Kansas, in 2009, spent $11,427 per student. Texas spent $11,085, according to the National Center for Education Statistics. Considering only spending deemed by NCES to be for instruction, it was Kansas at $6,162 per student and Texas at $5,138.

    Texas also has a higher pupil/teacher ratio. Texas has 14.56 students for each teacher. In Kansas, it’s 13.67. (2009 figures, according to NCES.)

    So for those who believe that school spending is positively correlated with student success, Kansas and Texas NAEP scores are evidence that they’re correct in their belief.

    But let us take another look at the Kansas and Texas NAEP scores. Here’s a table of 2011 scores.

    kansas-texas-naep-test-scores-2011

    Notice that when reporting scores for all students, Kansas has the highest scores, except for one tie. But when we look at subgroups, all the sudden the picture is different: Texas has the best scores in all cases, except for two ties. Similar patterns exist for previous years.

    Kansas students score better than Texas students, that is true. It is also true that Texas white students score better than Kansas white students, Texas black students score better than Kansas black students, and Texas Hispanic students score better than or tie Kansas Hispanic students. The same pattern holds true for other ethnic subgroups.

    How can this be? The answer is Simpson’s Paradox. A Wall Street Journal article explains: “Put simply, Simpson’s Paradox reveals that aggregated data can appear to reverse important trends in the numbers being combined.”

    The Wikipedia article explains: “A paradox in which a trend that appears in different groups of data disappears when these groups are combined, and the reverse trend appears for the aggregate data. … Many statisticians believe that the mainstream public should be informed of the counter-intuitive results in statistics such as Simpson’s paradox.”

    In this case, the confounding factor (“lurking” variable) is that the two states differ greatly in the proportion of white students. In Kansas, 69 percent of students are white. In Texas it’s 33 percent. This large difference in the composition of students is what makes it look like Kansas students perform better on the NAEP than Texas students.

    But looking at the scores for ethnic subgroups, which state would you say has the most desirable set of NAEP scores?

    Kansas progressives and those who support more spending on schools say we don’t want to be like Texas. I wonder if they are aware of Simpson’s Paradox and how it conceals important facts about Kansas school performance.

  • Brief filed in Kansas school finance case

    Kansas Judicial Center in snowWalt Chappell has filed a brief providing argument and evidence relevant to the current Kansas school finance case. Many expect that the Kansas Supreme Court will rule by the end of the year so that the legislature may act without the uncertainty of a court ruling still in the future.

    In a message accompanying his brief, Chappell explained his reasons for filing the brief. You may view the brief below after Chappell’s message, or click here to view in full screen mode at Scribd.

    On Friday, September 6th, I filed the attached Amicus Brief with the Kansas Supreme Court in the Gannon school finance case. While serving as a member of the State Board of Education, I had the unique opportunity to gather longitudinal data which verifies that the $2 billion increase in K-12 funding over the past 10 years has not produced a measurable increase in student achievement.

    The brief is short, but the data in the Appendices are powerful. After reading the analysis and legislative recommendations to increase productivity, it will be clear that there is absolutely no justification for increasing appropriations or raising taxes to give K-12 school districts significantly more money to spend.

    There are bills already drafted which will save more per year than the $809 million demanded by the Gannon plaintiffs. By working together, Kansas leaders can make significant improvements in what and how we teach our children without massive increases in funding.

    Hopefully the longitudinal data and analyses in this brief will be helpful as you write news stories about the Gannon case and school finance. This is a major issue and will increase taxes on all sectors of the state economy if the Court rules that more money is required without first implementing legislation to improve productivity and the effectiveness of how money is currently spent to educate Kansas children.

  • Why are Kansas school standards so low?

    Row of lockers in school hallwayAt a time when Kansas was spending more on schools due to an order from the Kansas Supreme Court, the state lowered its already low standards for schools.

    This is the conclusion of the National Center for Education Statistics, based on the most recent version of Mapping State Proficiency Standards Onto the NAEP Scales. NCES is the primary federal entity for collecting and analyzing data related to education in the U.S. and other nations, and is located within the U.S. Department of Education and the Institute of Education Sciences.

    The mapping project establishes a relationship between the tests each state gives to assess its students and the National Assessment of Education Progress, a test that is the same in all states. As explained earlier this week in Kansas school standards and other states, Kansas standards are relatively low, compared to other states. This video explains. (View below, or click here to view in HD at YouTube.)

    For Kansas, here are some key findings. First, NCES asks this question: “How do Kansas’s NAEP scale equivalent scores of reading standards for proficient performance at grades 4 and 8 in 2009 compare with those estimated for 2005 and 2007?”

    For Kansas, the two answers are this (emphasis added):

    “Although no substantive changes in the reading assessments from 2007 to 2009 were indicated by the state, the NAEP scale equivalent of both its grade 4 and grade 8 standards decreased.

    Also: “Kansas made substantive changes to its reading grade 8 assessment between 2005 and 2009, and the NAEP scale equivalent of its grade 8 standards decreased.

    In other words, NCES judged that Kansas weakened its standards for reading performance.

    A similar question was considered for math: “How do Kansas’s NAEP scale equivalent scores of mathematics standards for proficient performance at grades 4 and 8 in 2009 compare with those estimated for 2005 and 2007?”

    For Kansas, the two answers are this (emphasis added):

    “Although no substantive changes in the mathematics assessments from 2007 to 2009 were indicated by the state, the NAEP scale equivalent of its grade 8 standards decreased (the NAEP scale equivalent of its grade 4 standards did not change).”

    Also: “Kansas made substantive changes to its mathematics grade 4 assessment between 2005 and 2009, but the NAEP scale equivalent of its grade 4 standards did not change.”

    For mathematics, NCES judges that some standards were weakened, and some did not change.

    In its summary of Kansas reading standards, NCES concluded: “In both grades, Kansas state assessment results showed more positive changes in achievement than NAEP results.” For mathematics, the summary reads: “In grade 4, Kansas state assessment results showed a change in achievement that is not different from that based on NAEP results. In grade 8, state assessment results showed a more positive change.”

    In other words: In three of four instances, Kansas is claiming positive student achievement that isn’t apparent on national tests.

    Kansas is not alone in weakening its standards during this period. It’s also not alone in showing better performance on state tests than on national tests. States were under pressure to show increased scores, and some — Kansas included — weakened their state assessment standards in response.

    What’s important to know is that Kansas school leaders are not being honest with Kansans as a whole, and with parents specifically. In the face of these findings from NCES, Kansas Commissioner of Education Diane M. DeBacker wrote this in the pages of The Wichita Eagle: “Kansans are proud of the quality of their public schools, and a steady and continuing increase in student performance over the past decade has given us ample reason for that pride.” (Diane DeBacker : Pride in Kansas public schools is well-placed, March 20, 2012.)

    A look at the scores, however, show that national test results don’t match the state-controlled tests that DeBacker touts. She controls these states tests, by the way. See Kansas needs truth about schools.

    The same year a number of school district superintendents made a plea for increased funding in Kansas schools, referring to “multiple funding cuts.” (Reverse funding cuts, May 3, 2012 Wichita Eagle.) In this article, the school leaders claimed “Historically, our state has had high-performing schools, which make Kansas a great place to live, raise a family and run a business.”

    These claims made by Kansas school leaders are refuted by the statistics that aren’t under the control of these same leaders. Before courts rule on school spending, and before we change Kansas school standards, we need to realize the recent stewardship of Kansas schools under current leadership.

    Ask these questions before devoting more resources to Kansas public schools:

    Why are Kansas school standards so low compared to other states?

    Why did Kansas reduce its standards at the same time school spending was increasing?

    Following are two examples of where Kansas school standards rank compared to other states. Click on them for larger versions.

    naep-scale-equivalents-state-grade-4-reading-2009

    Kansas Grade 4 Math Standards 01