Tag: Education
-
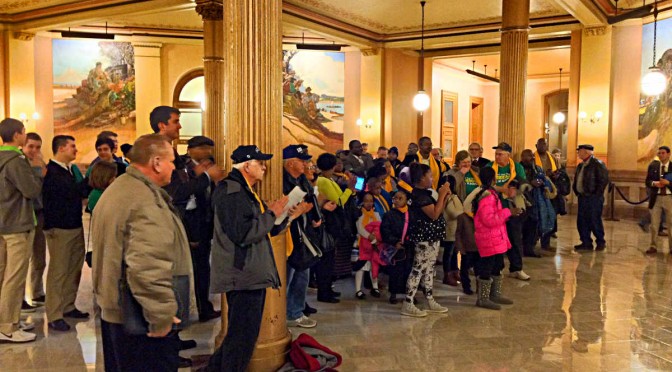
Rally for school choice in Kansas
Parents and children from around Kansas rallied in the Kansas Capitol for school choice.
-
In Kansas, resolving school district spending variances could yield savings
Large variances in spending among school districts show that efficiency efforts driven by the Legislature could easily yield hundreds of millions in savings, writes Dave Trabert of Kansas Policy Institute.
-
Better outcomes at a better price in Johnson County
If the other five Johnson County districts operated at the per-pupil cost of De Soto, the burden on taxpayers could be reduced by $127.1 million, writes Dave Trabert of Kansas Policy Institute.
-
College environmentalists use public records laws
College environmentalists are using public records laws to investigate the circumstances surrounding the hiring of an economist at the University of Kansas.
-
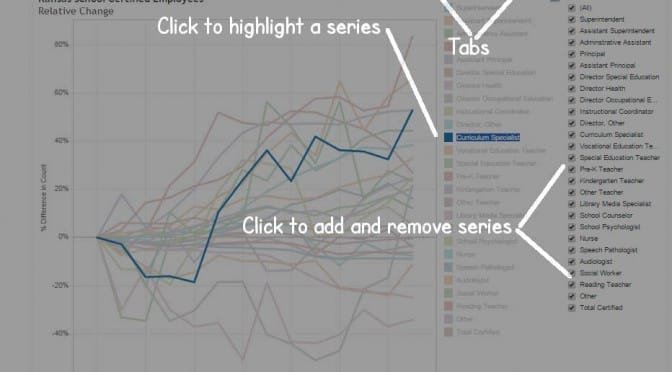
Kansas school employees by type
An interactive visualization of trends in Kansas school employment.
-

What we can learn from the piano
The purchase of a piano by a Kansas school district teaches us a lesson. Instead of a system in which schools raise money voluntarily — a system in which customers are happy to buy, donors are happy to give, and schools are grateful to receive — we have strife.
-

How do school choice programs affect budgets and performance of school districts?
Opponents of school choice programs argue the programs harm school districts, both financially and in their ability to serve their remaining students. Evidence does not support this position.
-
Kansas school funding controversy is about entitlement, not need
When every Johnson County school district qualifies as a property-poor district, you know you have a broken school funding formula … and a controversial claim based on entitlement, writes Dave Trabert of Kansas Policy Institute.
-

Judicial panel used cherry-picked data in Gannon decision
If the increase in education funding prescribed in the most recent Gannon decision were to become a reality, it would mean a nice raise for teachers and likely more administrators, but student outcomes would remain flat and achievement gaps would continue, writes David Dorsey of Kansas Policy Institute.
-
The philosophy and research supporting at-risk funding
What is the philosophy behind spending more taxpayer dollars to educate economically disadvantaged students, and what does the research say, asks David Dorsey of Kansas Policy Institute.
-

For Kansas schools, a share of your income is the standard
If Kansas personal income rises but the school spending establishment doesn’t get its cut, something is wrong, they say.
-
At risk school funding in Kansas
At risk funding provides extra dollars to schools based on the number of economically disadvantaged students enrolled, writes David Dorsey of Kansas Policy Institute.