Tag: Education
-
Kansas schools and other states
A joint statement released by Kansas Association of School Boards, United School Administrators of Kansas, Kansas School Superintendents’ Association, and Kansas National Education Association makes claims about Kansas public schools that aren’t factual.
-

Must it be public schools?
A joint statement released by Kansas Association of School Boards, United School Administrators of Kansas, Kansas School Superintendents’ Association, and Kansas National Education Association exposes the attitudes of the Kansas public school establishment.
-
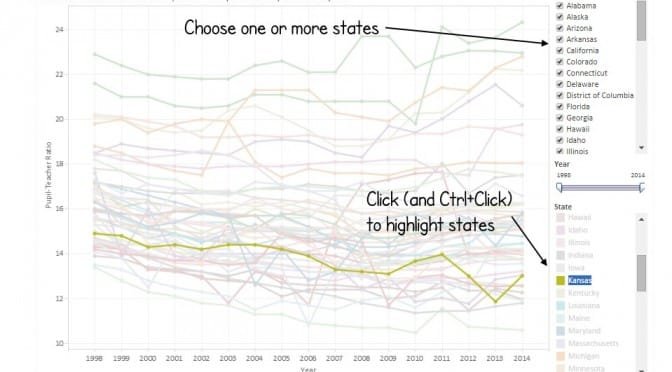
Pupil-teacher ratios in the states
Kansas ranks near the top of the states in having a low pupil-teacher ratio.
-

Kansas school employment
Kansas school employment declined for the current school year, and ratios of employees to pupils rose.
-

School choice in Kansas: The haves and have-nots
Kansas non-profit executives work to deny low-income families the school choice opportunities that executive salaries can afford.
-
WichitaLiberty.TV: What the Kansas Legislature should do, and eminent domain
There are things simple and noncontroversial that the Kansas Legislasture should do in its upcoming session, and some things that won’t be easy but are important. Also, a look at eminent domain.
-

Survey finds Kansans with little knowledge of school spending
As in years past, a survey finds that when Kansans are asked questions about the level of school spending, few have the correct information.
-

Kansas school reform
A Wichita economist and attorney offers advice to a committee of the Kansas Legislature on reforming Kansas schools for student achievement.
-
Kansas at-risk school funding report released
The Kansas at-risk program, which spent $3.6 billion over the past 23 years, failed its mission to improve the performance of the very students it was designed to serve, finds Kansas Policy Institute.
-
Kansas school employees by type
An interactive visualization of trends in Kansas school employment.
-
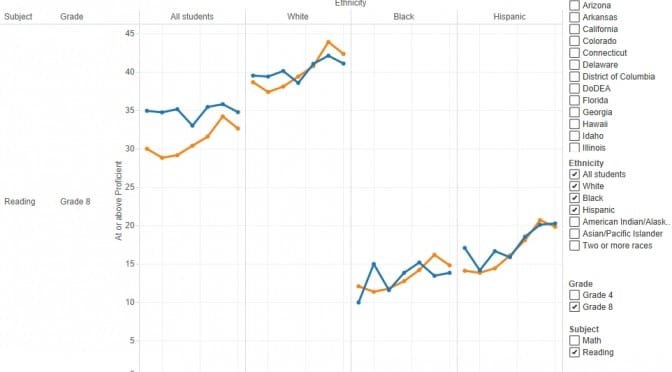
Kansas NAEP scores for 2015
Reactions to the release of National Assessment of Educational Progress scores for Kansas and the nation. Also, an interactive visualization.
-
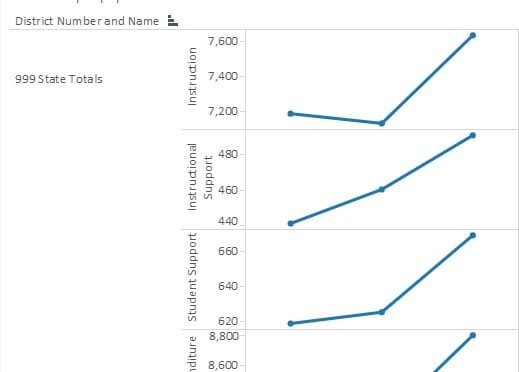
Kansas school support
An interactive visualization of data provided to members of the Kansas 2015 Special Committee on K-12 Student Success.