Tag: Economics
-
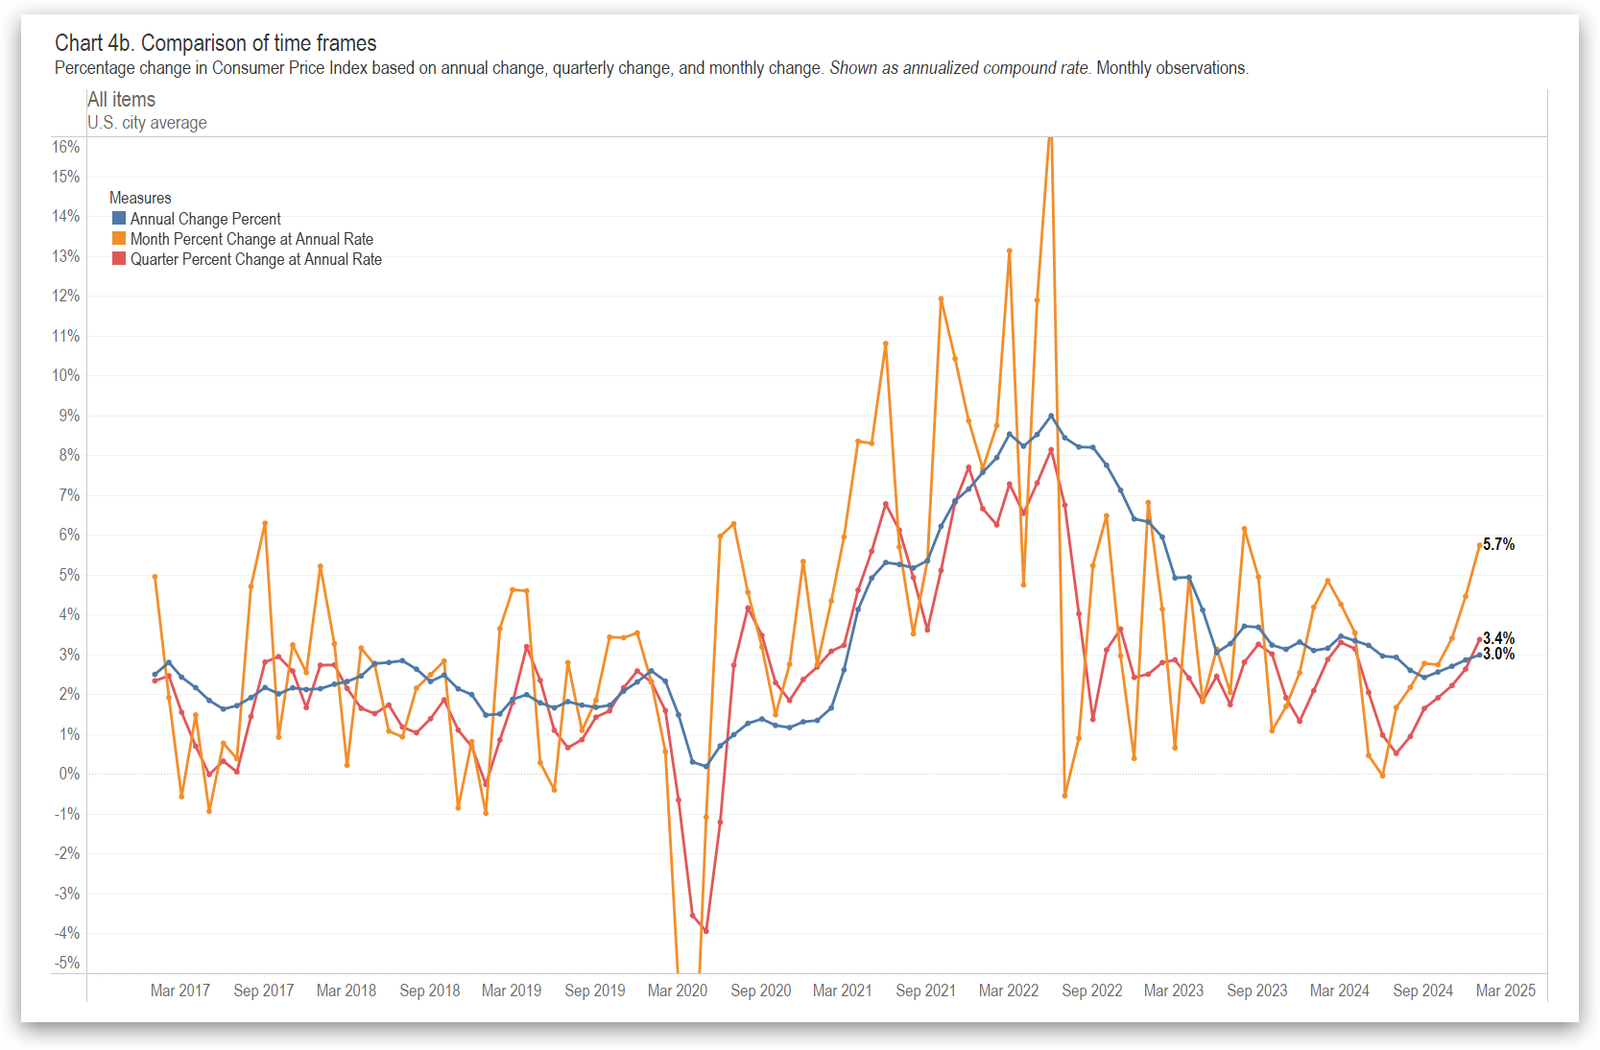
Inflation and Consumer Price Index, January 2025
Looking at inflation calculations in a different way.
-
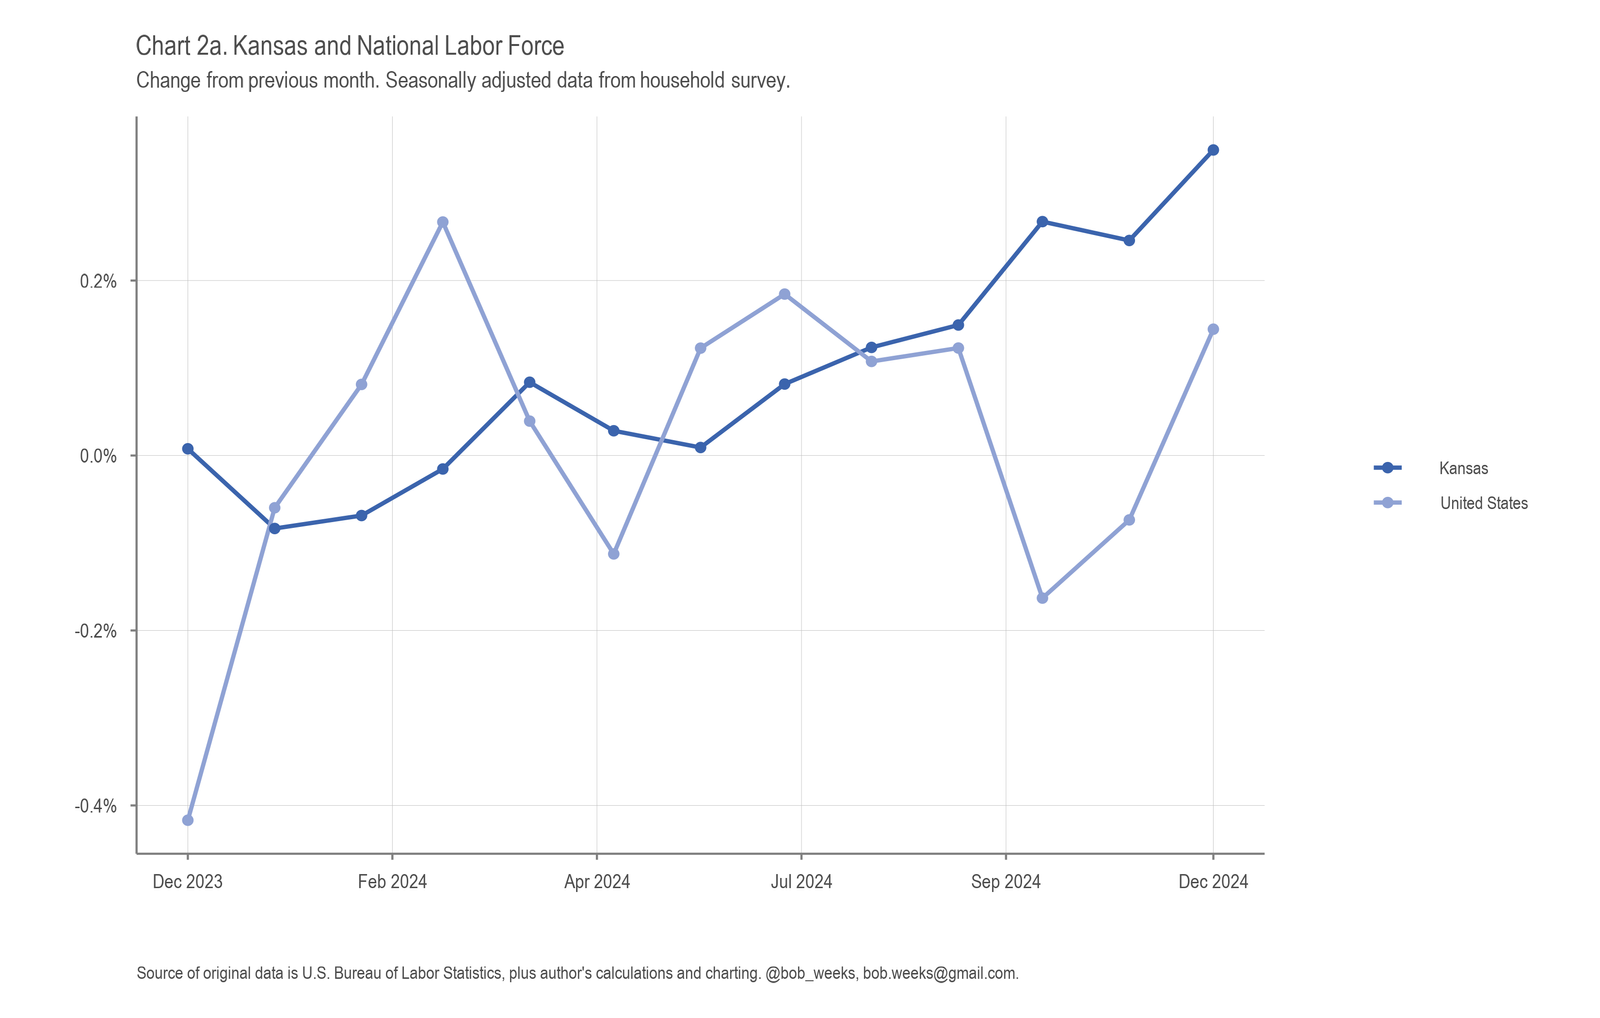
Kansas Employment Situation, December 2024
In Kansas in December 2024, the labor force rose, the number of jobs was rose, and the unemployment rate rose compared to the previous month, all by modest amounts. Over the year, Kansas is near the midpoint of states in job growth.
-
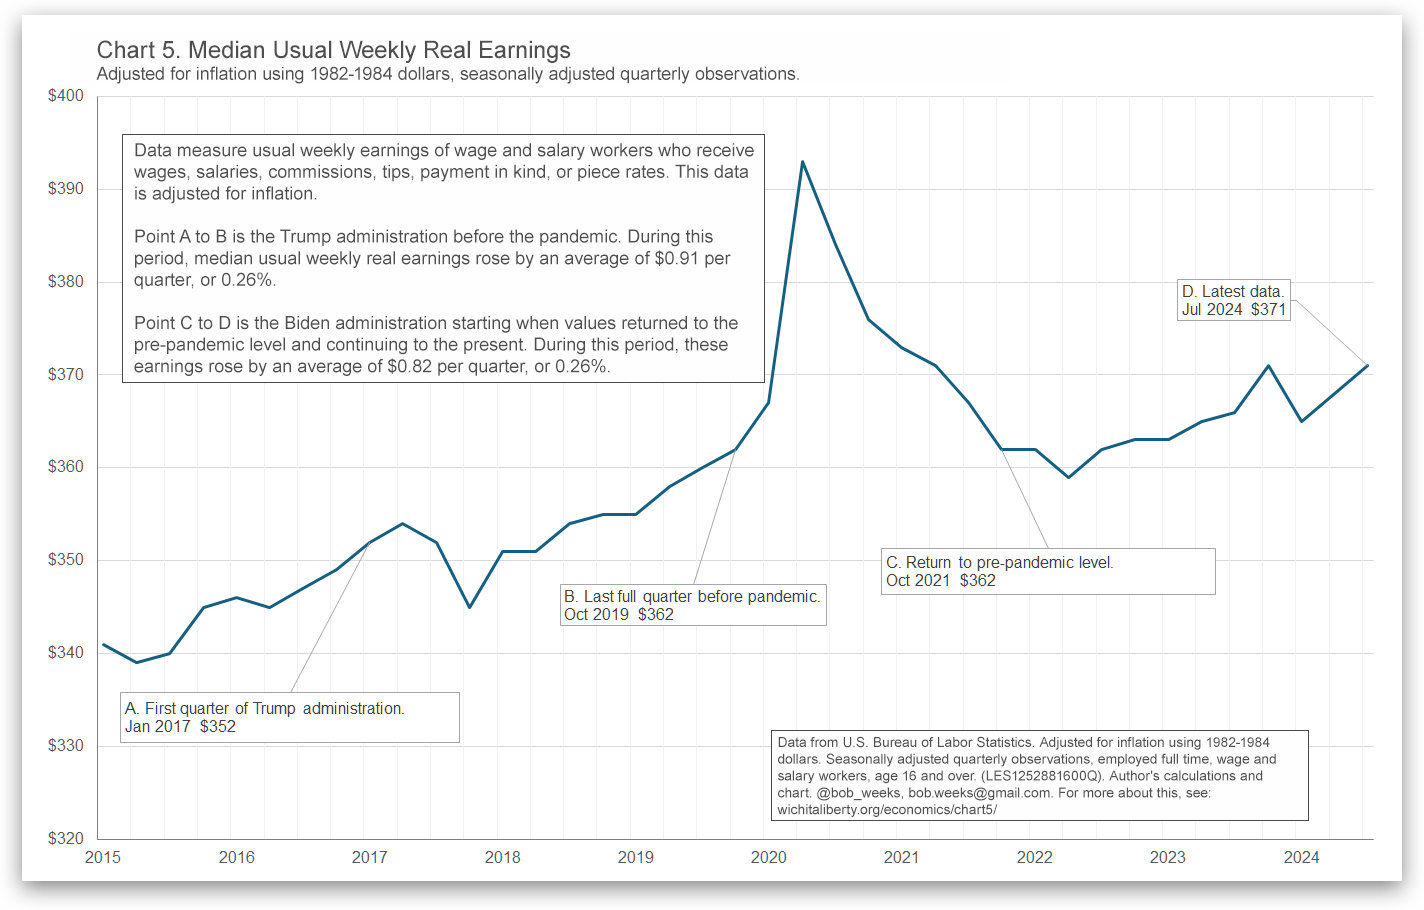
Median Usual Weekly Real Earnings, pre- and post-Covid
Comparing weekly earnings before and after the Covid pandemic, attempting to remove the effect of the pandemic.
-
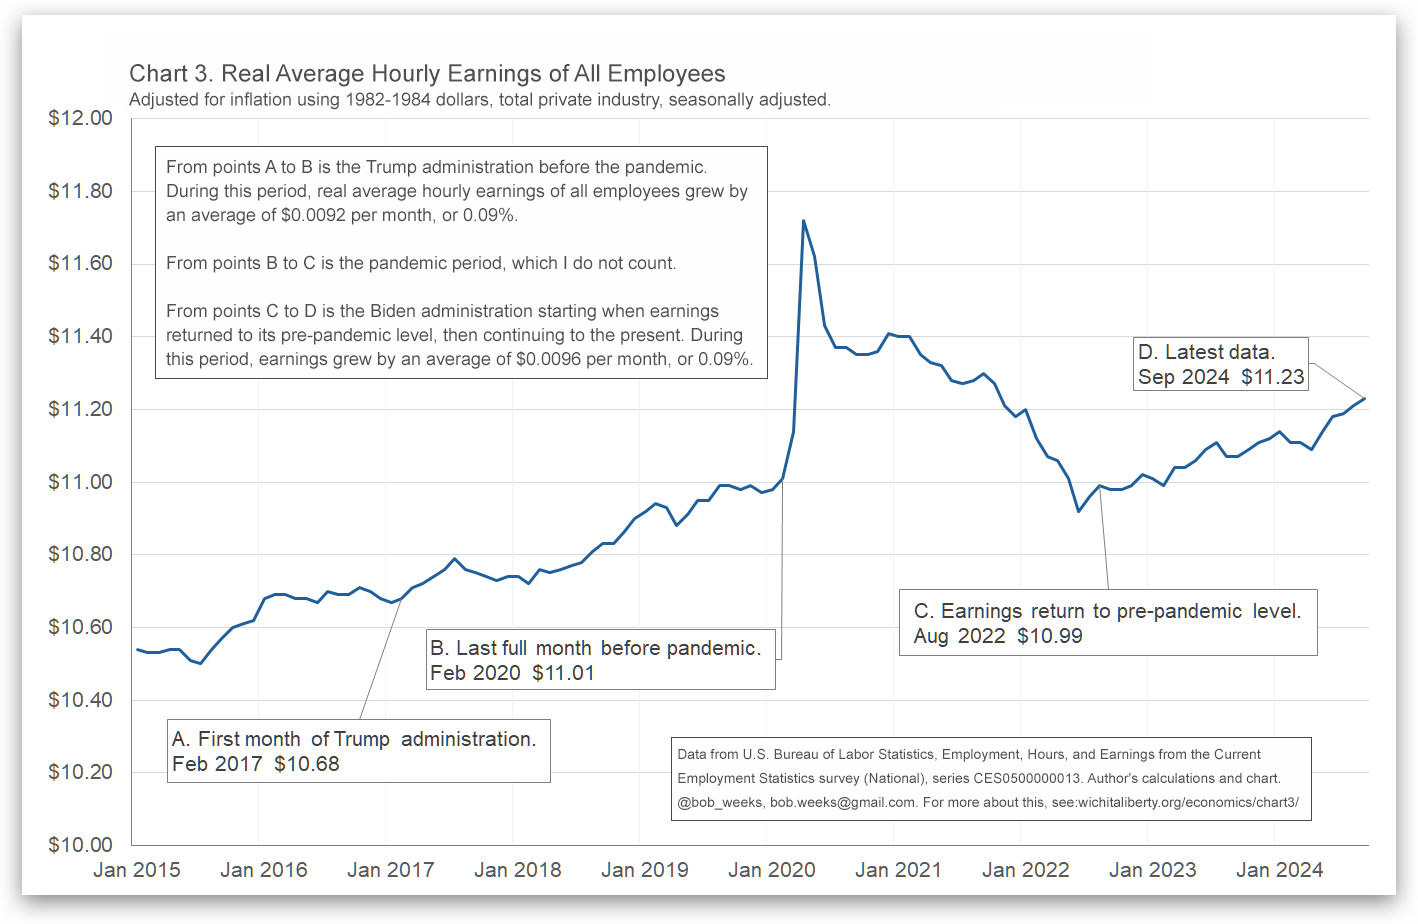
Hourly Earnings, pre- and post-Covid
Comparing hourly earnings before and after the Covid pandemic, attempting to remove the effect of the pandemic.
-

Employment, pre- and post-Covid
Comparing job growth before and after the Covid pandemic, attempting to remove the effect of the pandemic.
-
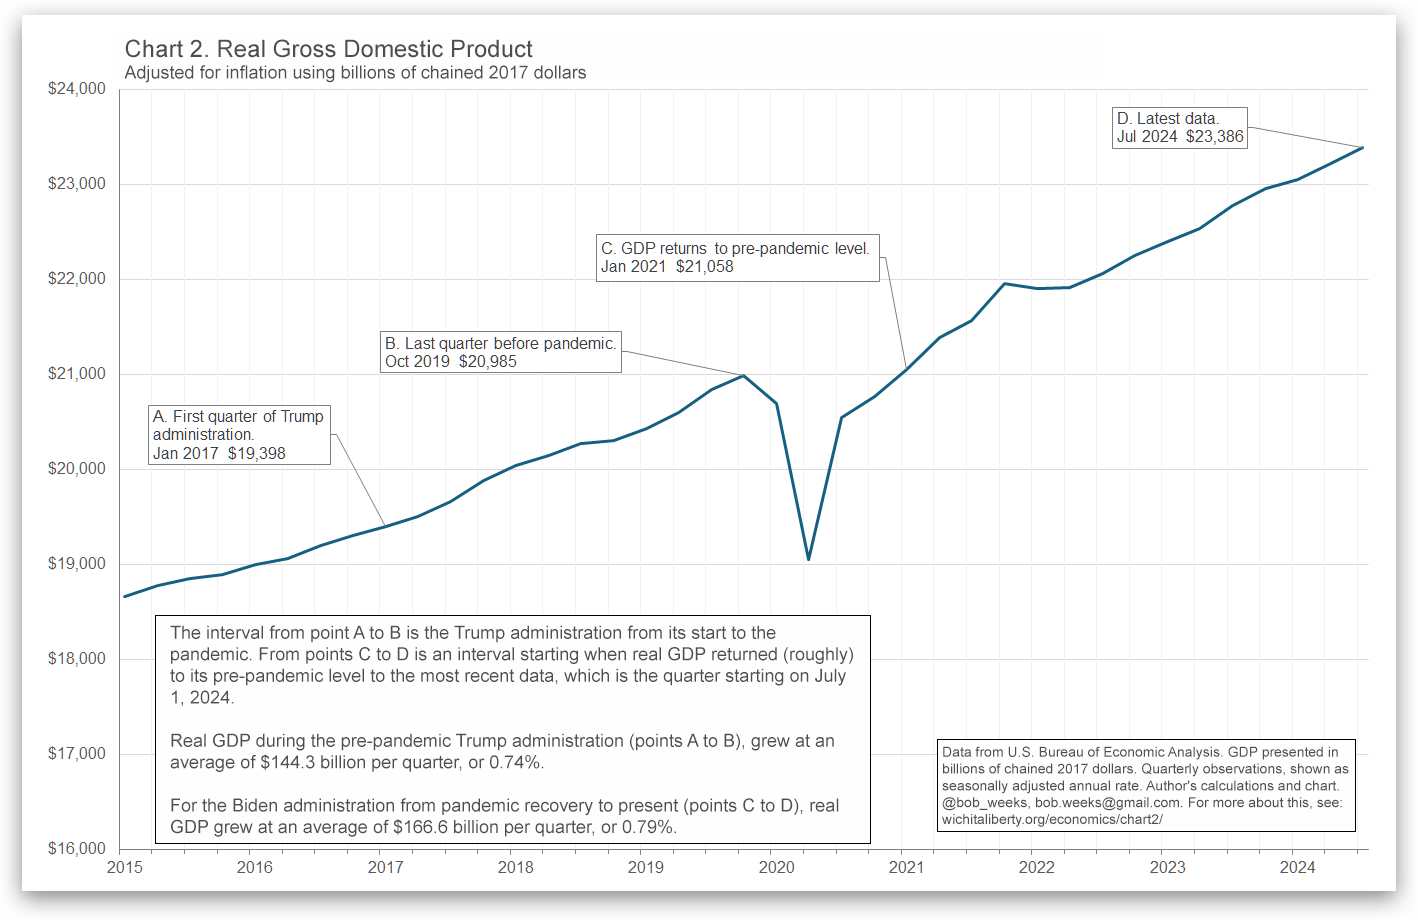
Gross Domestic Product, pre- and post-pandemic
Recent economic performance as measured by Gross Domestic Product, before and after the pandemic.
-
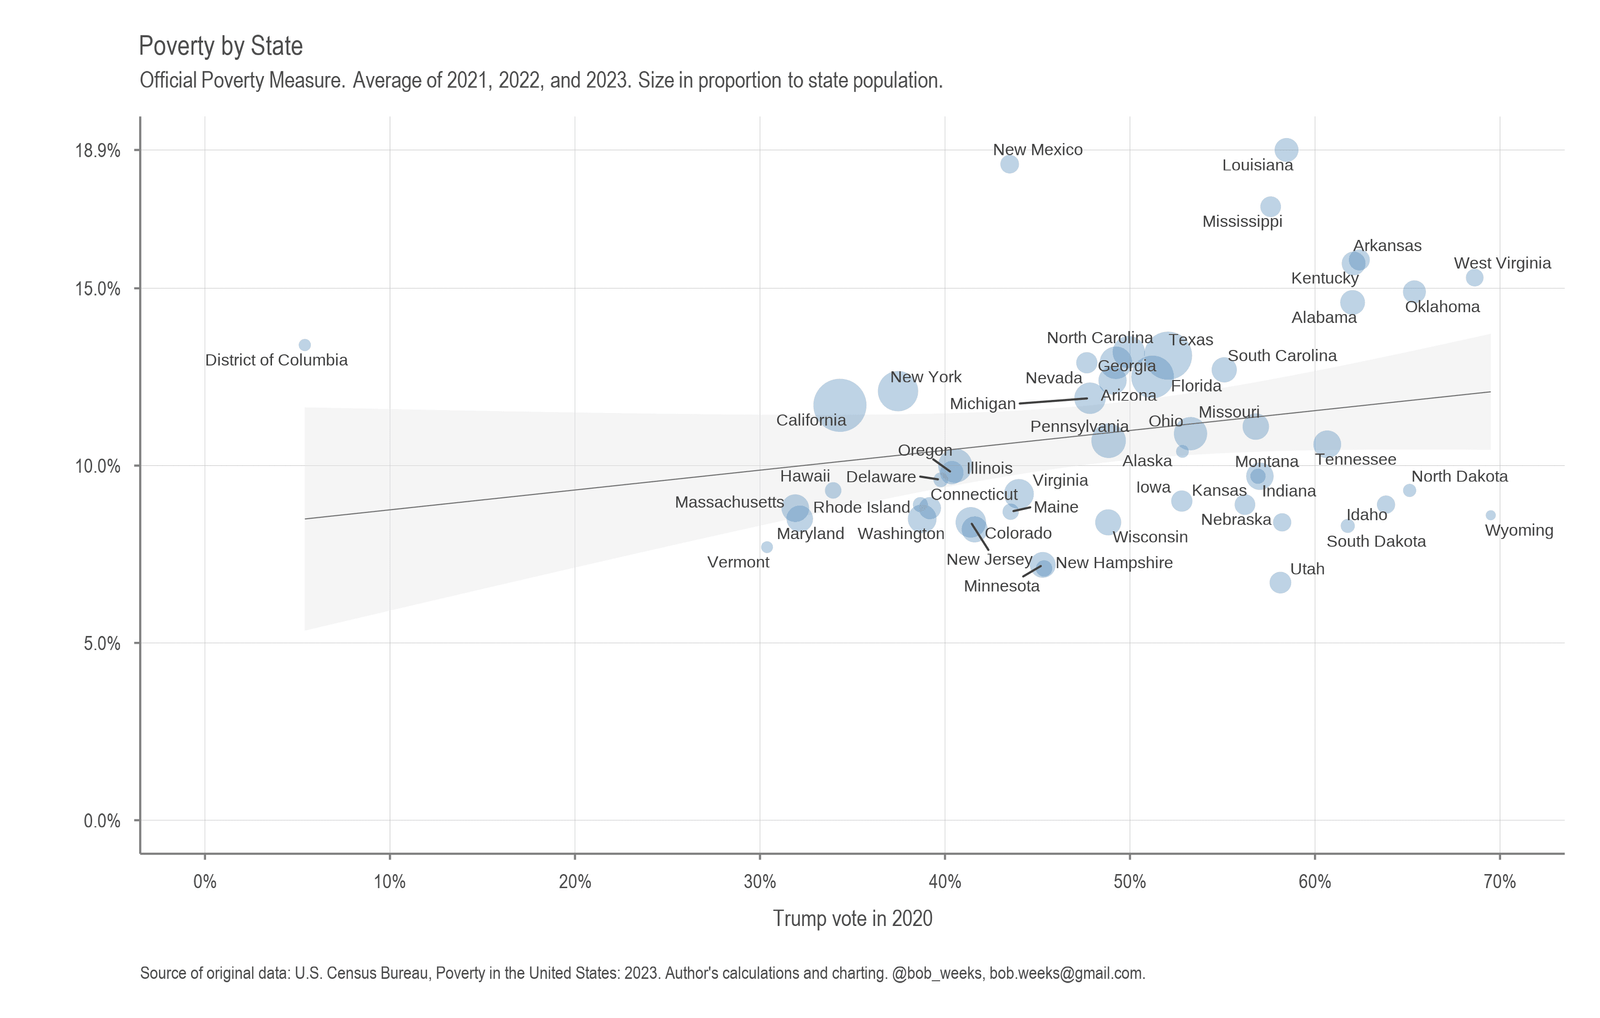
Poverty in the States
Official and supplemental poverty rates in the states.
-
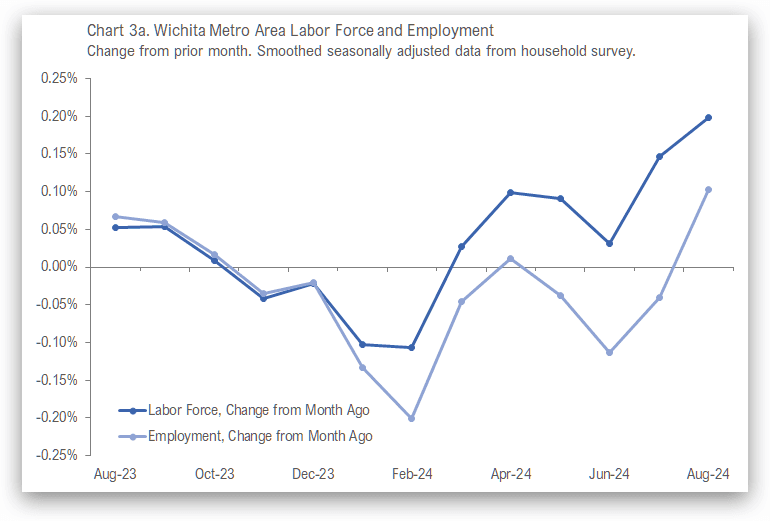
Wichita Employment Situation, August 2024
For the Wichita metropolitan area in August, most employment indicators improved slightly from the prior month. Wichita continues to perform poorly compared to its peers.
-
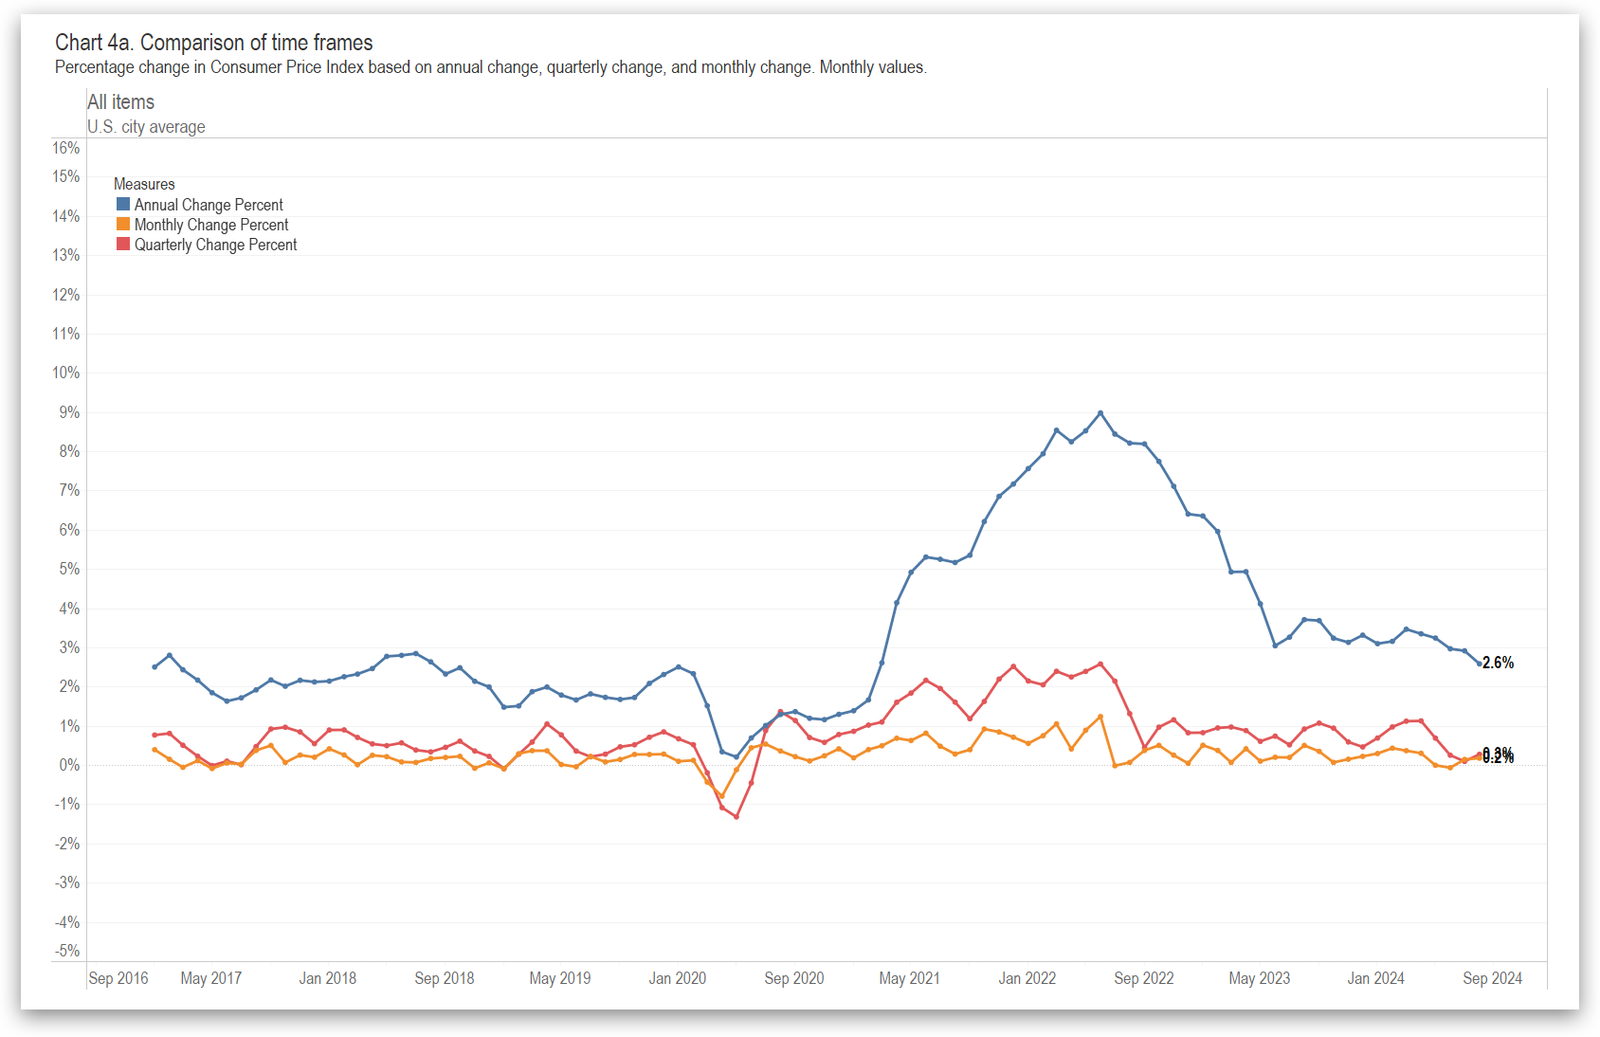
Inflation and Consumer Price Index, September 2024
Looking at inflation calculations in a different way.