Tag: Economics
-

Kansas Employment Situation, December 2023
In Kansas in December 2023, the labor force fell, the number of jobs fell, and the unemployment rate fell when compared to the previous month, all by small amounts. Over the year, Kansas is far below the middle of the states in job growth.
-
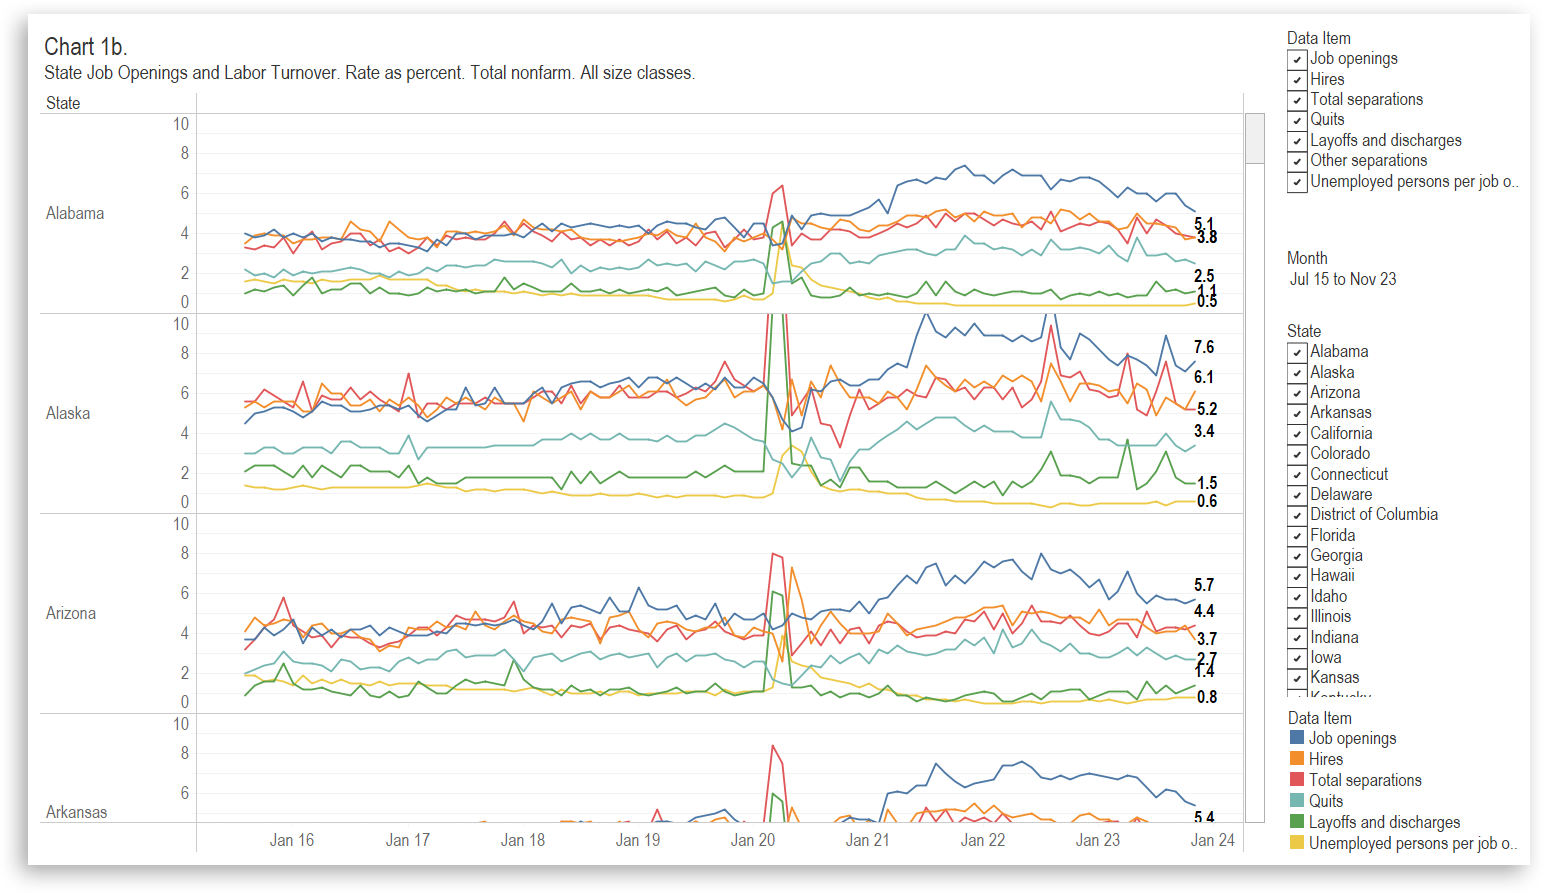
State Job Openings and Labor Turnover
Data on monthly job turnover in the states and presented in an interactive visualization.
-
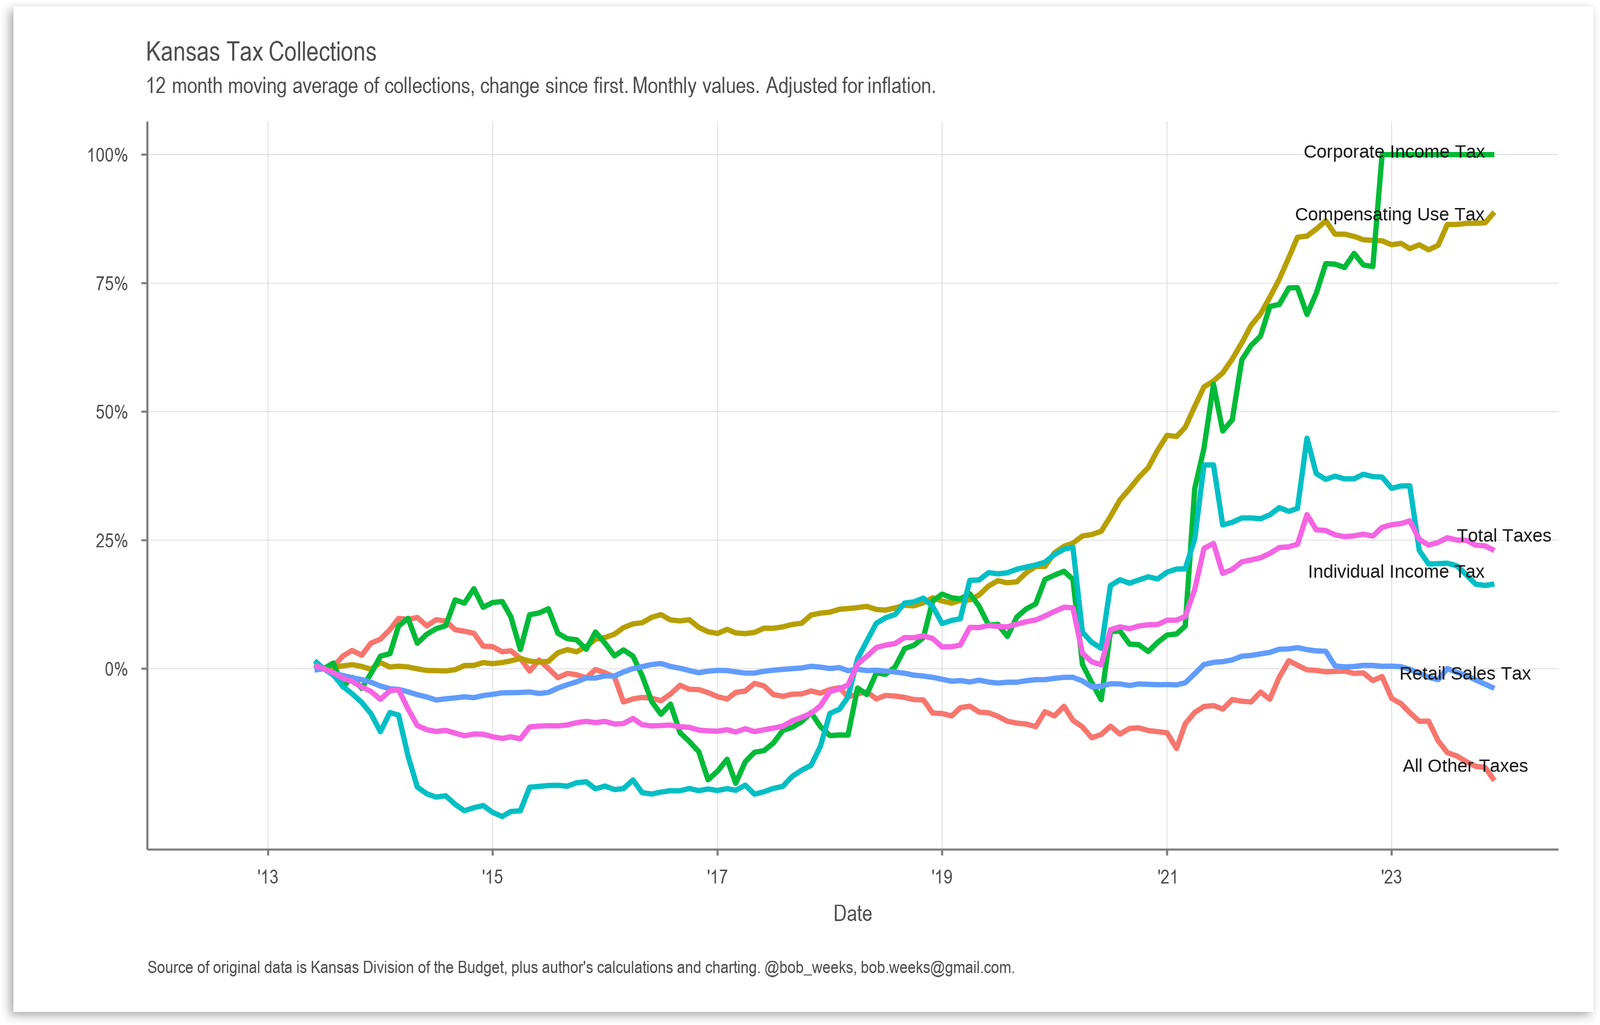
Kansas Tax Revenue, December 2023
For December 2023, Kansas tax revenue was 3.8 percent lower than December 2022, and 3.4 percent lower than estimated.
-
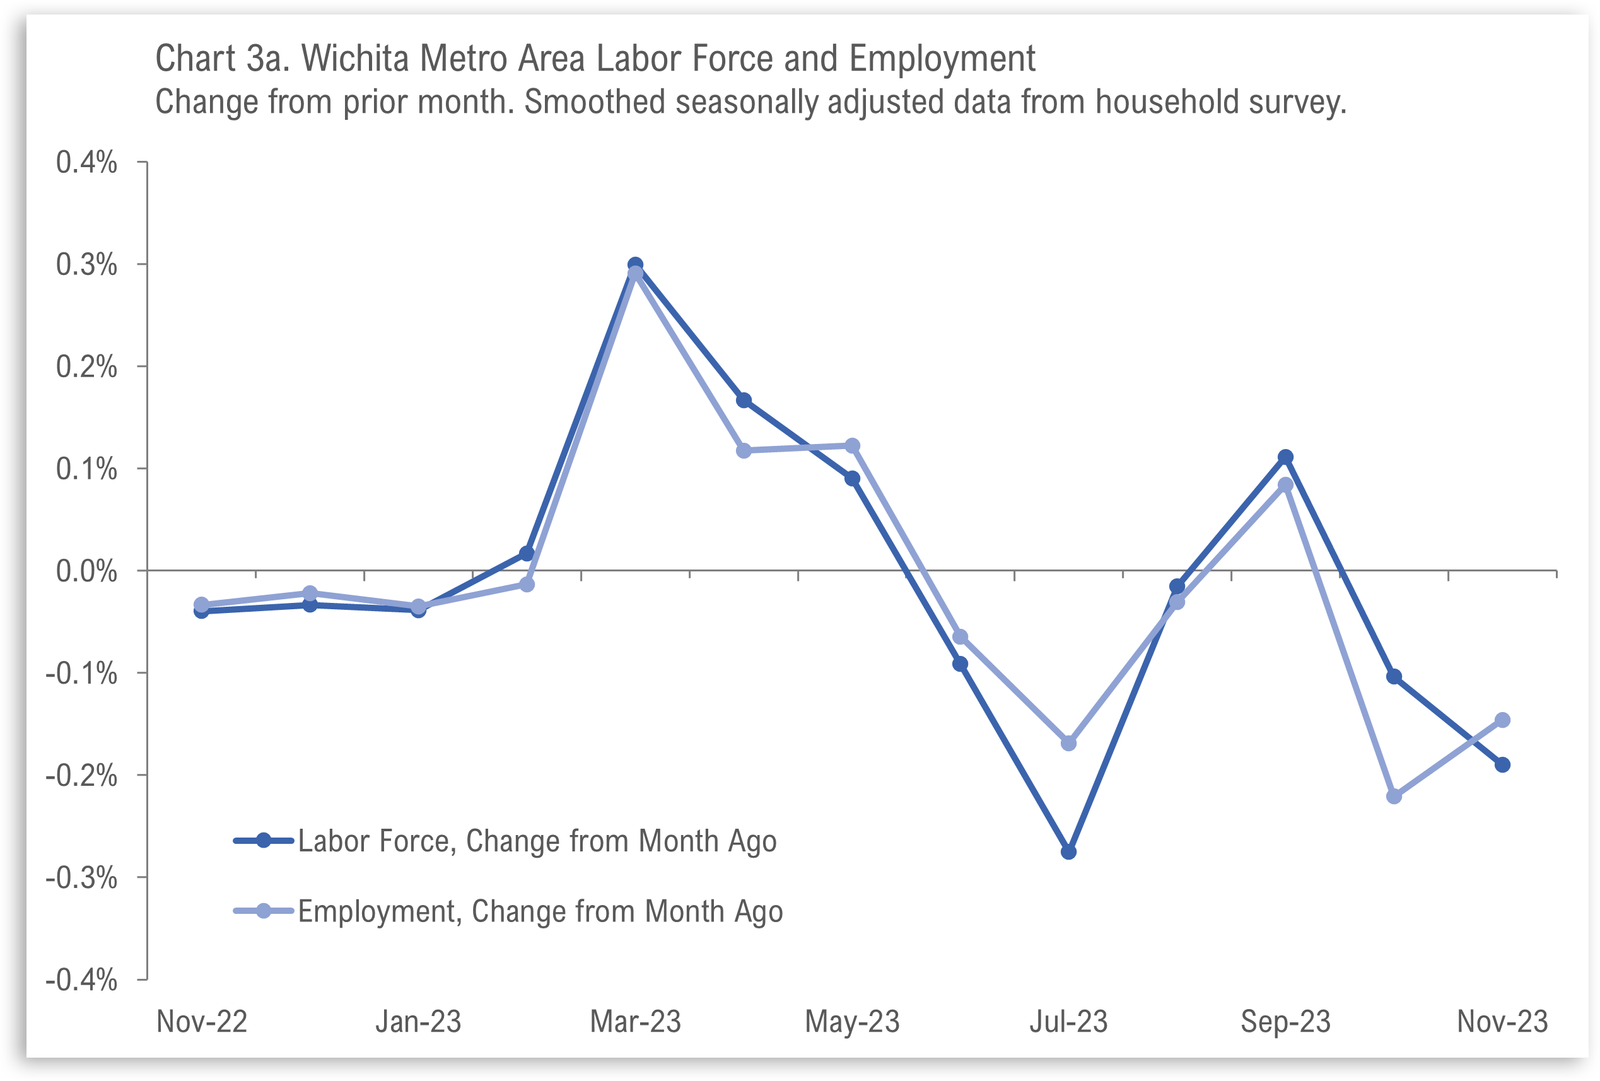
Wichita Employment Situation, November 2023
For the Wichita metropolitan area in November 2023, major employment indicators declined from the prior month. Wichita continues to perform poorly compared to its peers.
-
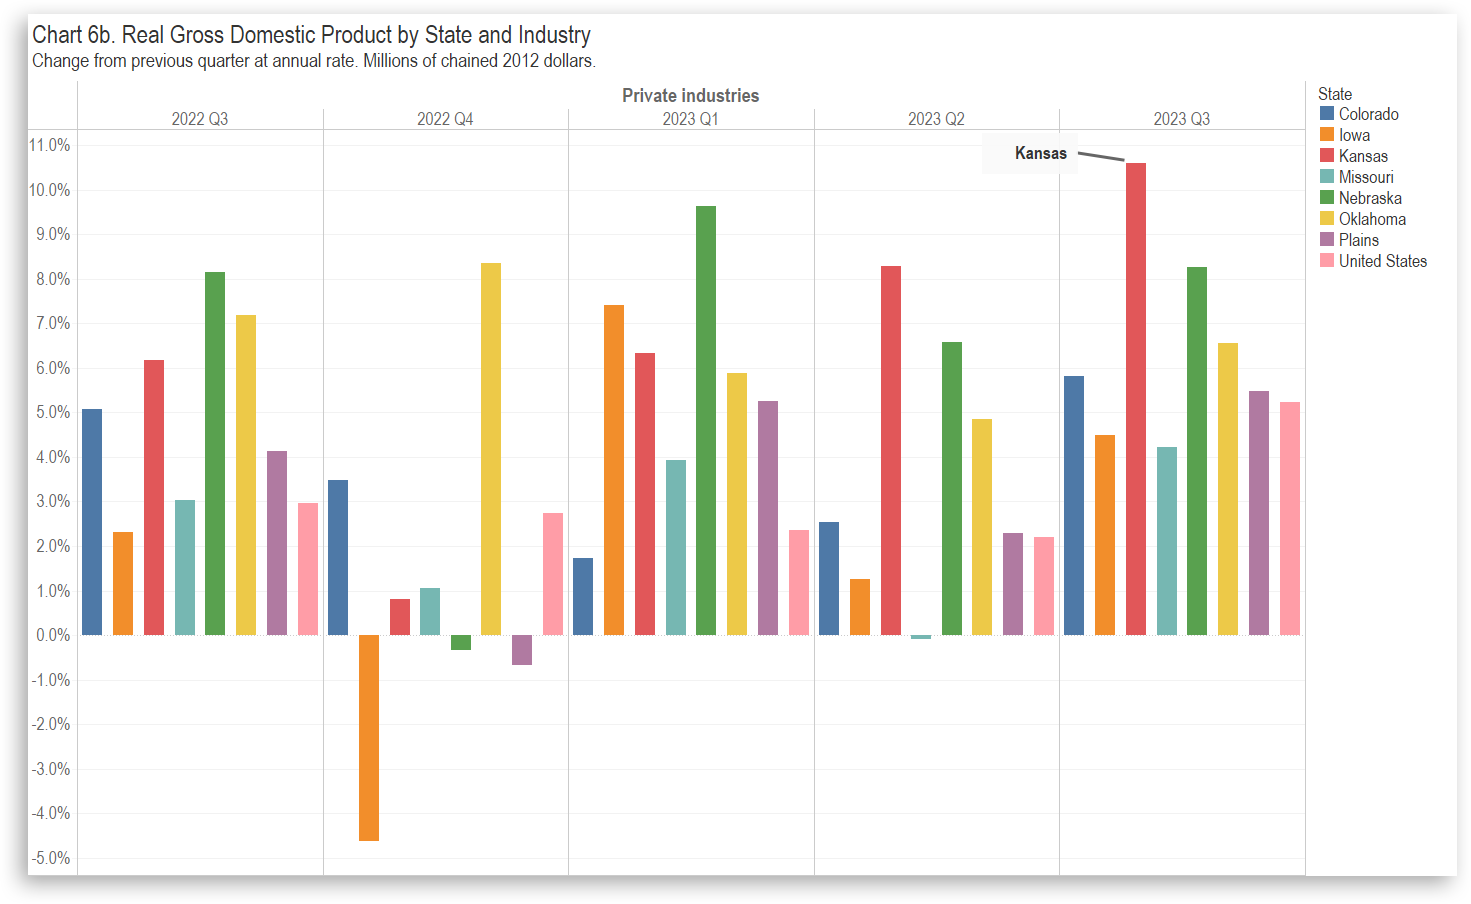
Kansas GDP, Third Quarter of 2023
In the third quarter of 2023, the Kansas economy grew at the annual rate of 9.7 percent. Real Gross Domestic Product rose in all states, with Kansas ranking first.
-
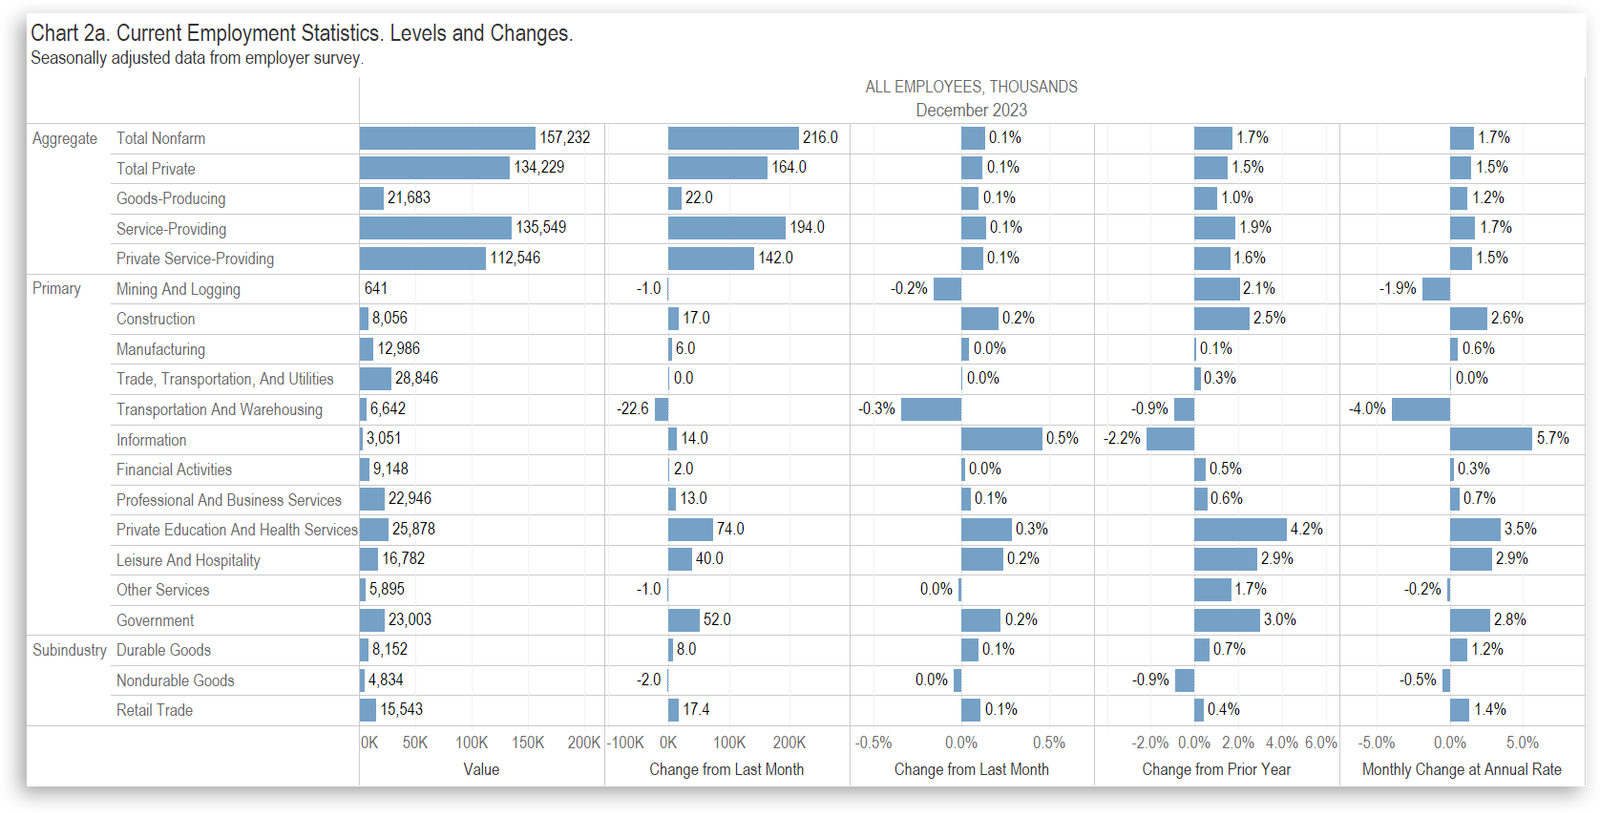
National Employment Situation, December 2023
Total nonfarm payroll employment increased by 216,000 in December 2023 from November 2023. The unemployment rate was unchanged at 3.7 percent.
-
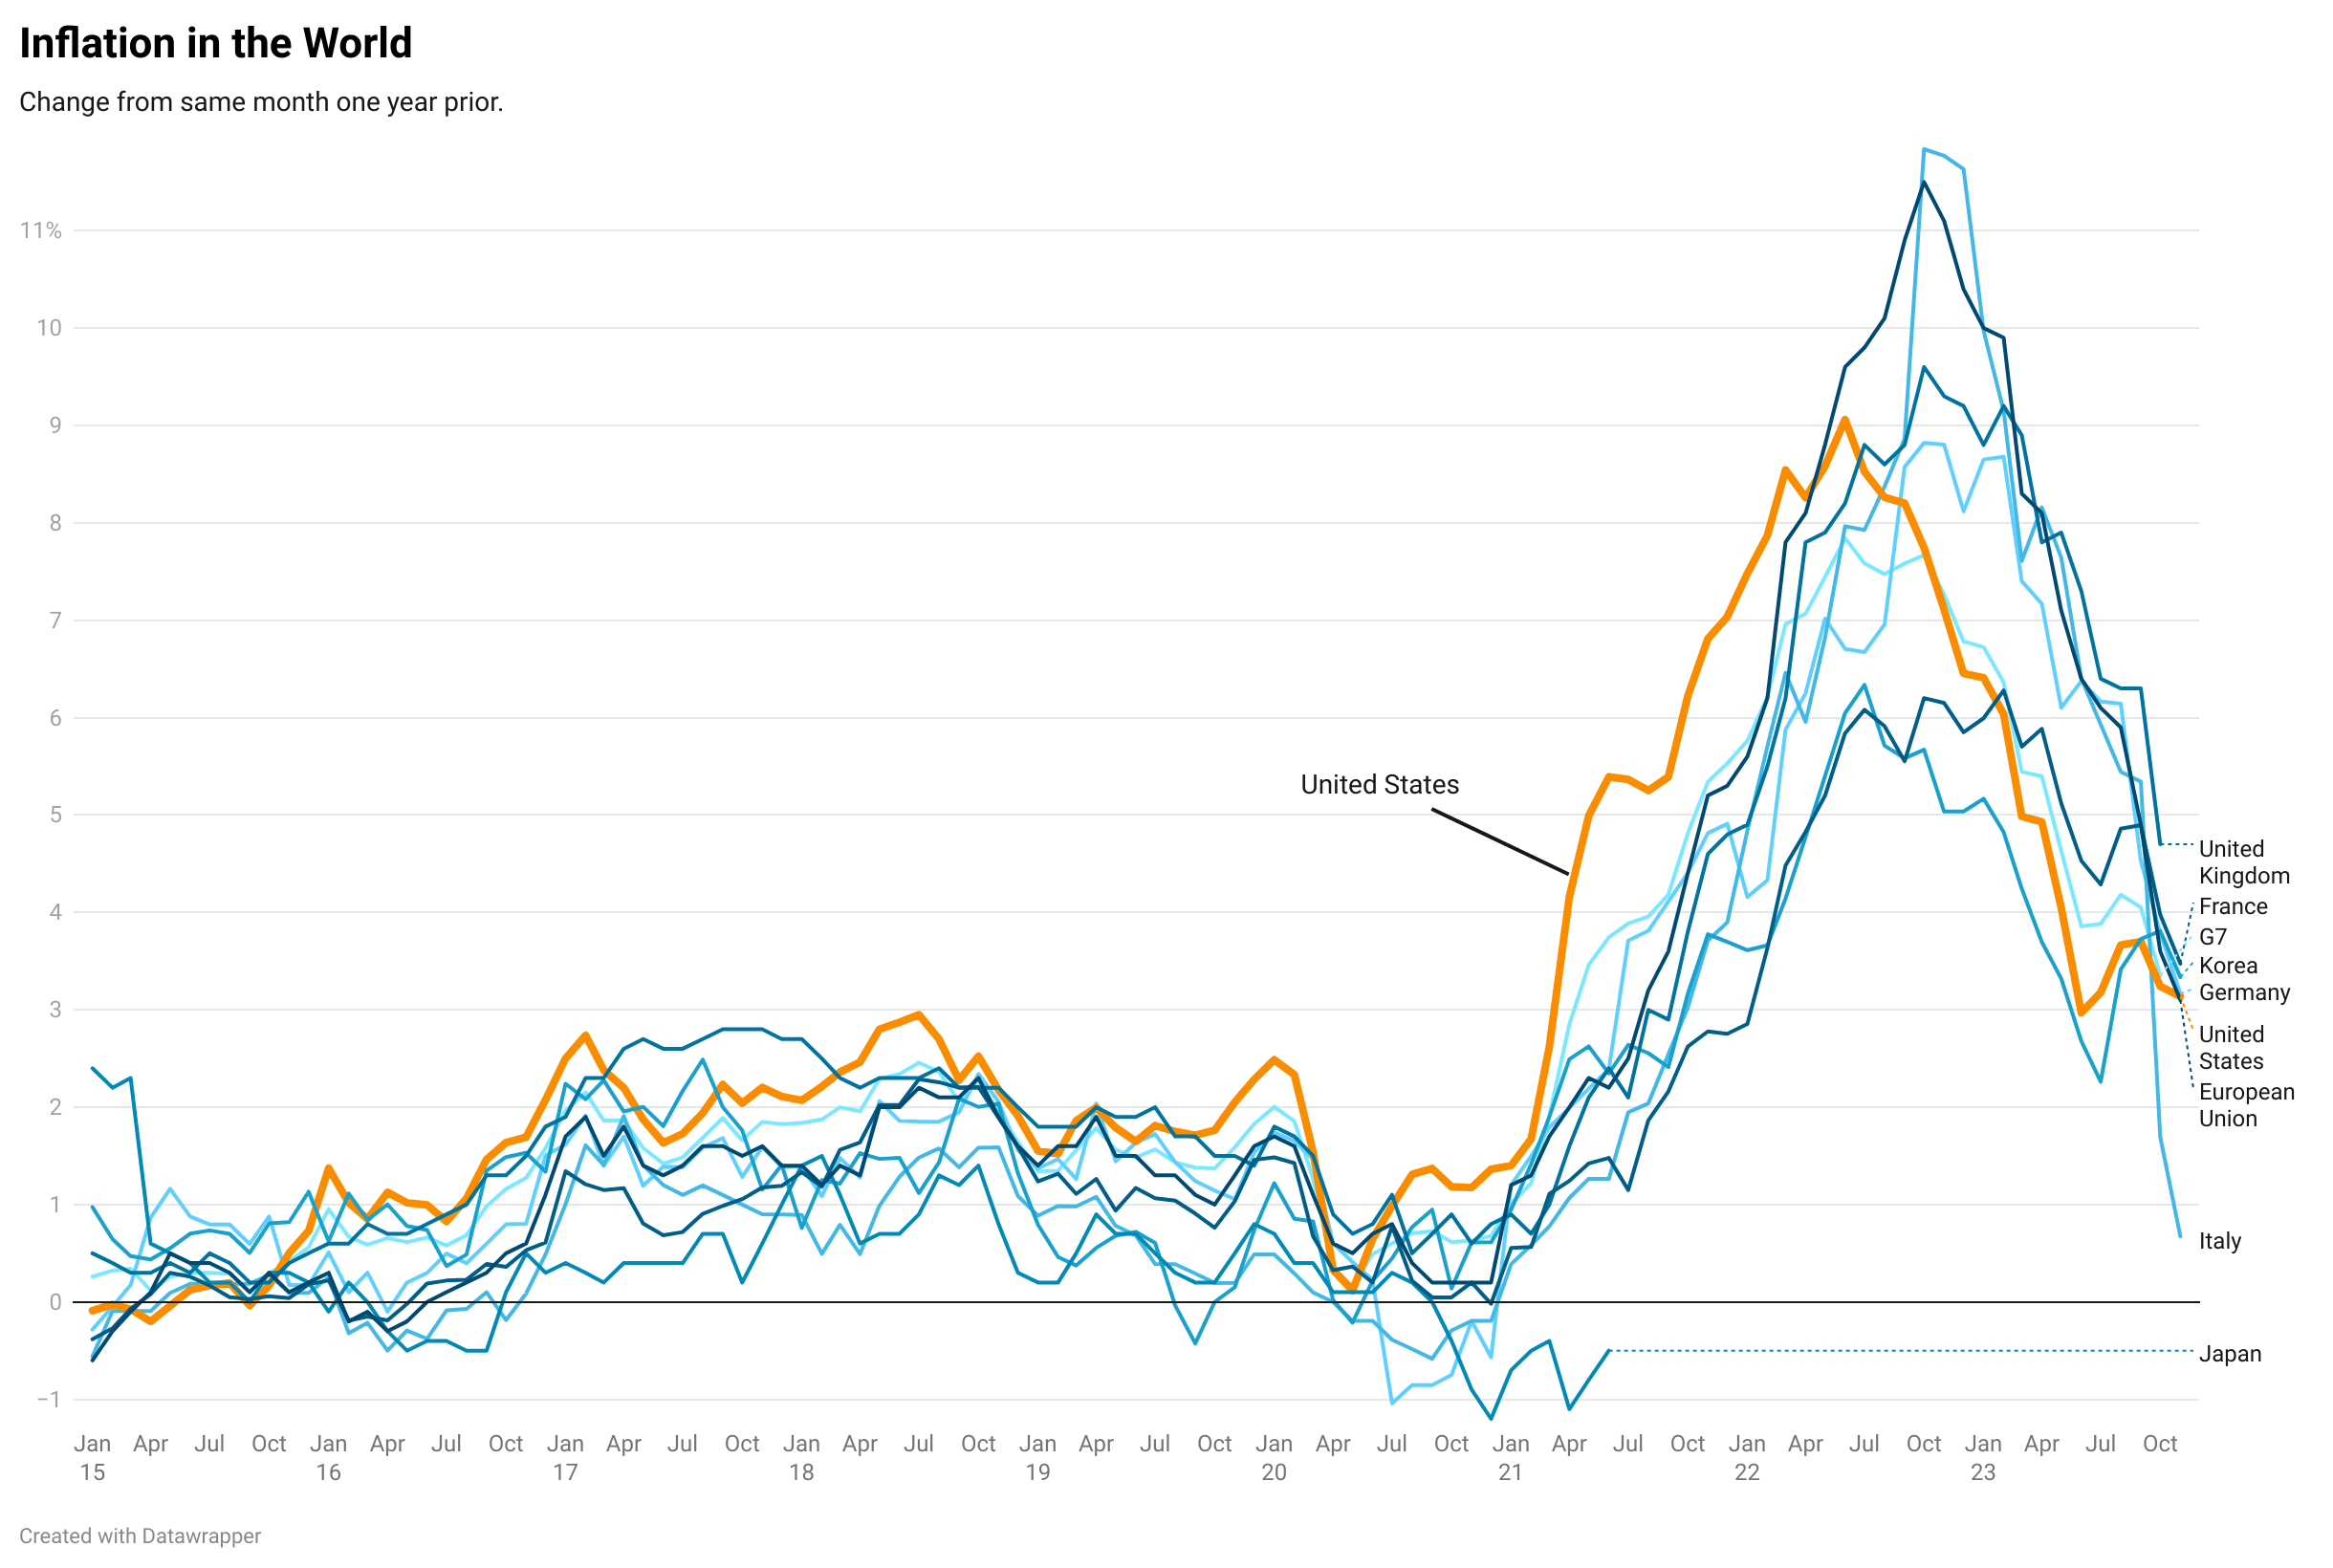
Inflation in the World
Interactive charts showing inflation as a worldwide issue.
-
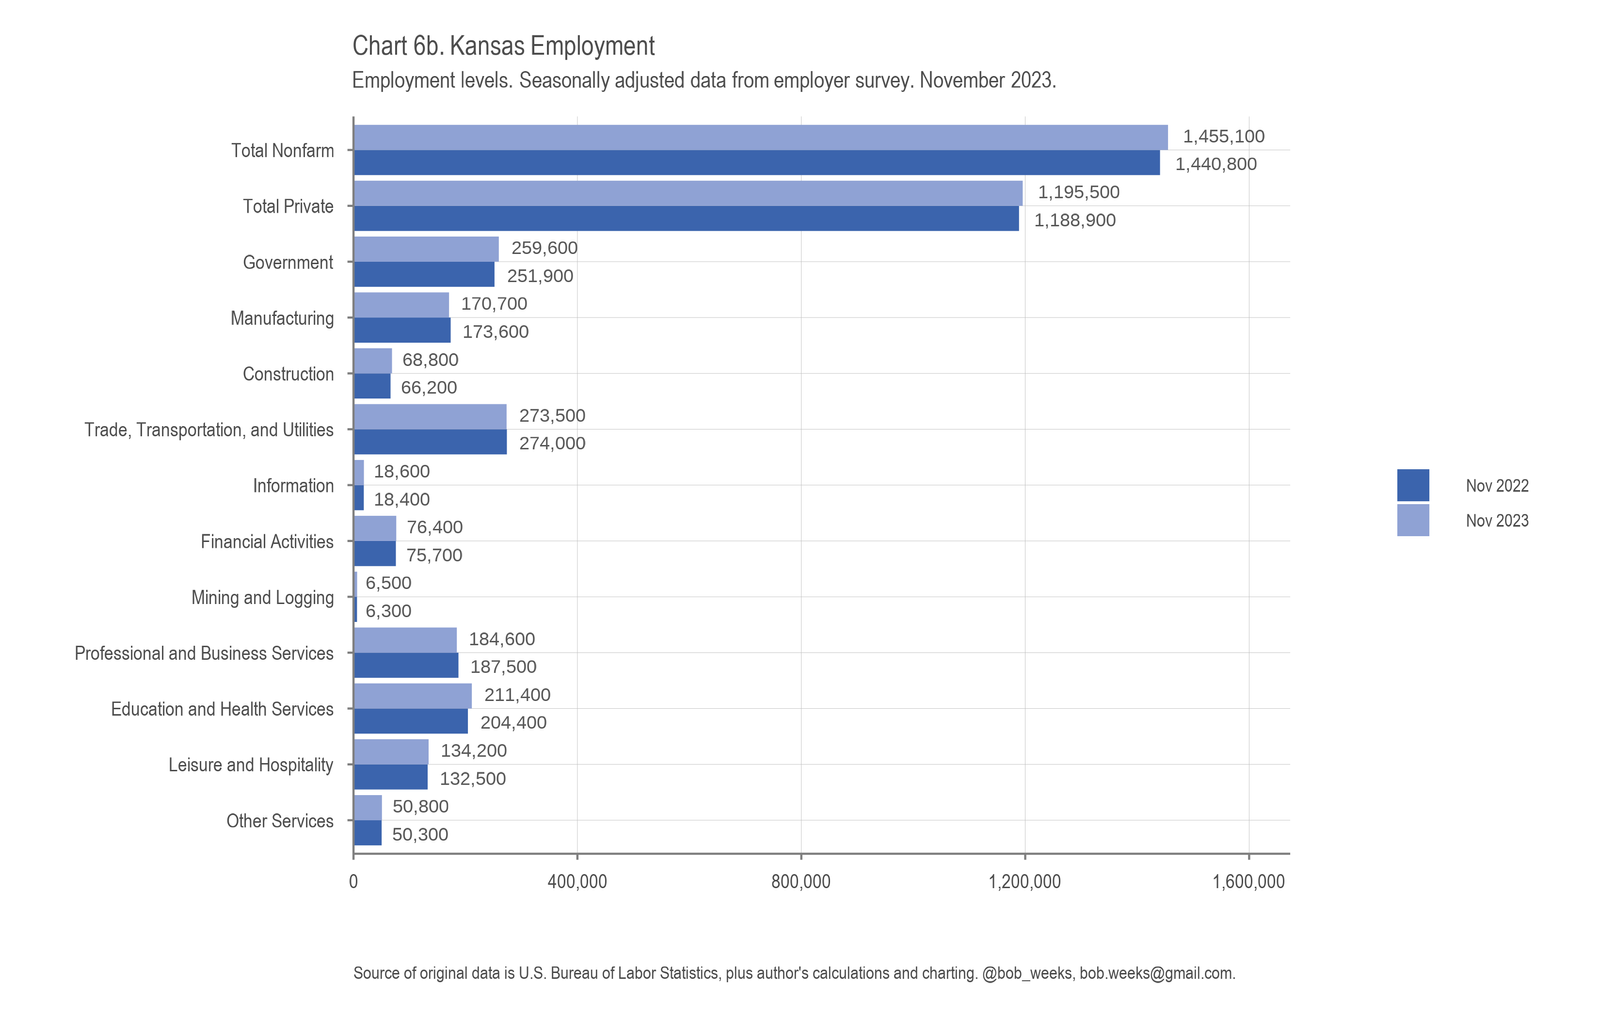
Kansas Employment Situation, November 2023
In Kansas for November 2023, the labor force fell, the number of jobs rose, and the unemployment rate was unchanged when compared to the previous month. Over the year, Kansas is below the middle of the states in job growth.
-
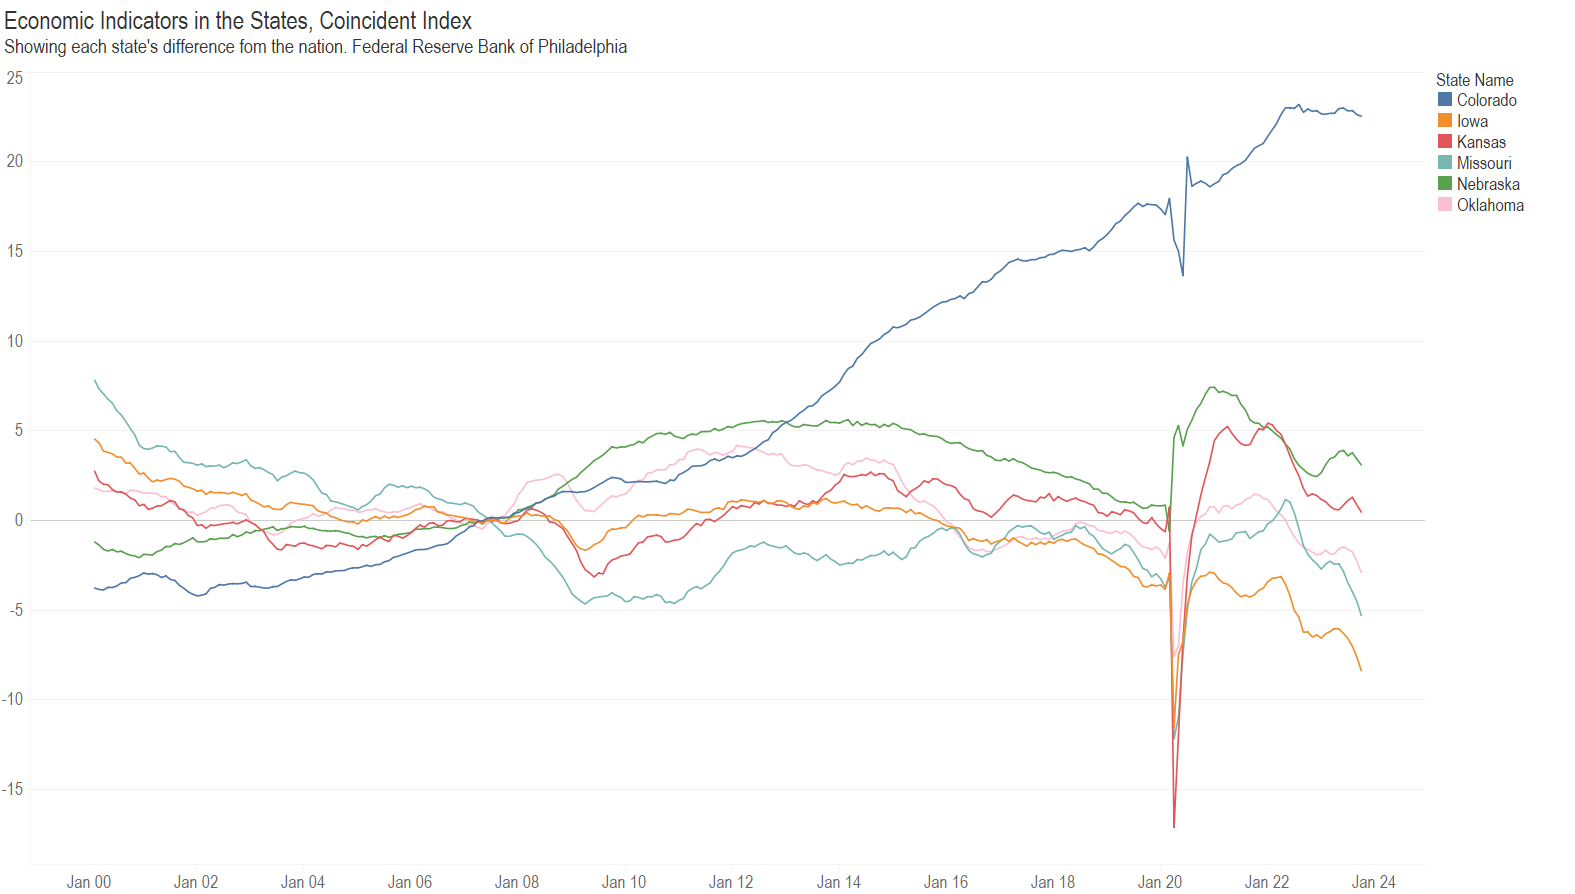
Economic Indicators in the States
A visualization of coincident economic indicators for the states.
-
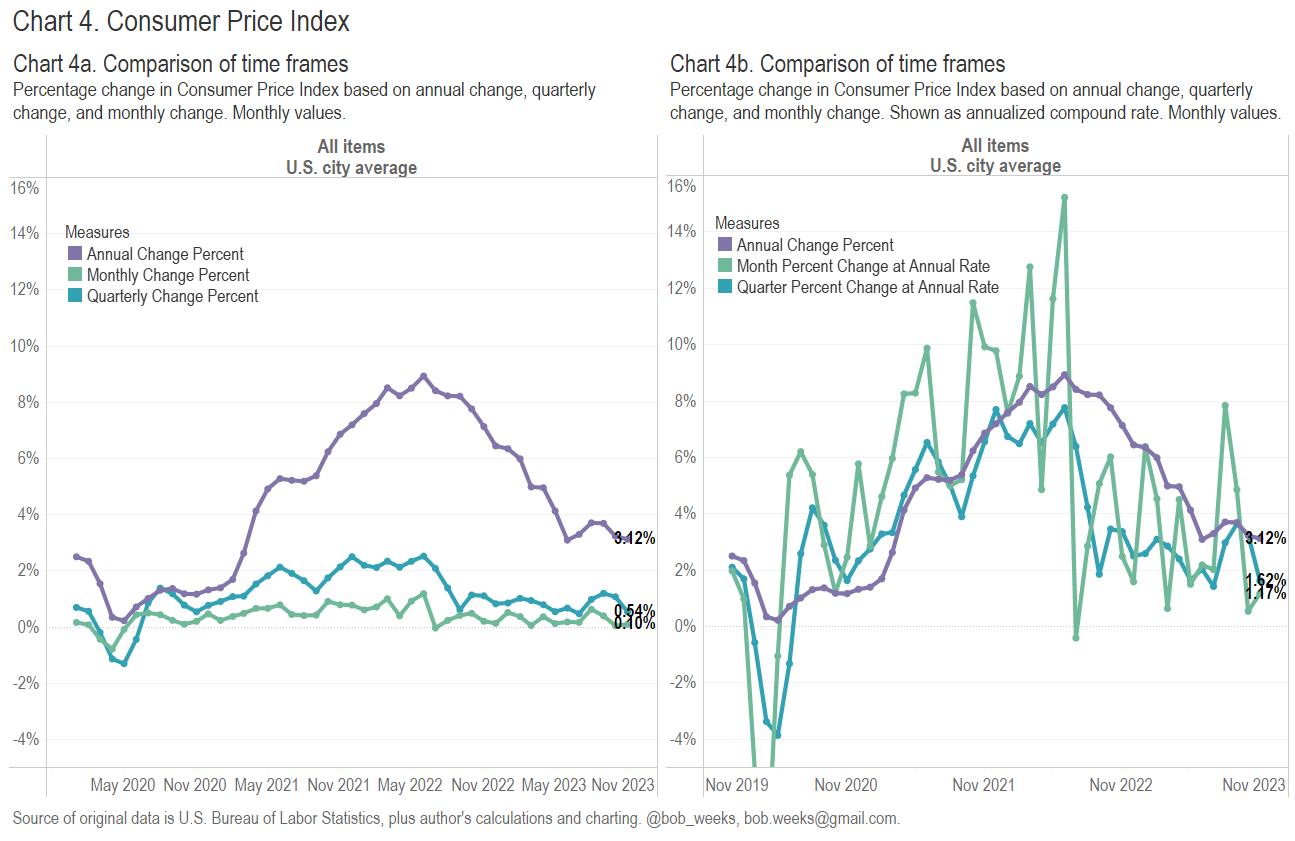
Consumer Price Index, November 2023
Looking at inflation calculations in a different way.
-

Gas Prices in Days Past
A meme on Facebook shows a photograph of gasoline prices from a past era with the caption: “Gas prices like this would be a nice gift.”
-
Kansas GDP, Second Quarter of 2023
In the second quarter of 2023, the Kansas economy grew at the annual rate of 7.4 percent. Real Gross Domestic Product rose in 44 states, with Kansas ranking second.