Tag: Charter schools
-

WichitaLiberty.TV: Trump and the Wichita Eagle, property rights and blight, teachers union, and capitalism
Was it “Trump” or “Bernie” that incited a fight, and how does the Wichita Eagle opine? Economic development in Wichita. Blight and property rights. Teachers unions. Explaining capitalism.
-

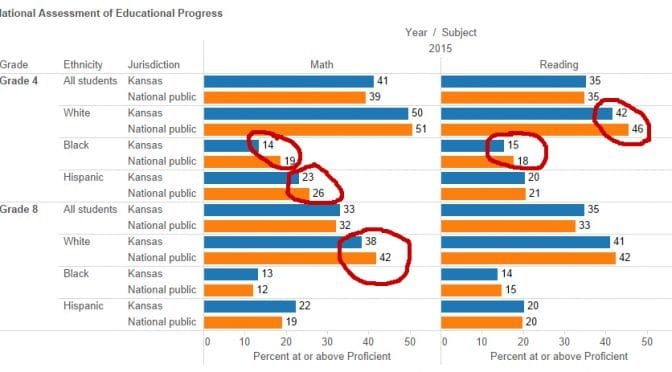
Kansas continues to snub school choice reform that helps the most vulnerable schoolchildren
Charter schools benefit minority and poor children, yet Kansas does not leverage their benefits, despite having a pressing need to boost the prospects of these children.
-

Kansas teachers union objects. Strenuously.
Here are a few items from today’s missive from Kansas National Education Association, the teachers union, along with commentary.
-

Kansas and Colorado, compared
News that a Wichita-based company is moving to Colorado sparked a round of Kansas-bashing, most not based on facts.
-

Must it be public schools?
A joint statement released by Kansas Association of School Boards, United School Administrators of Kansas, Kansas School Superintendents’ Association, and Kansas National Education Association exposes the attitudes of the Kansas public school establishment.
-

Kansas public school establishment ought to thank Sam Brownback
Kansas public schools ought to thank the governor and legislature for failing to give parents the power of school choice.
-

Block grants a chance for more school choice in Kansas
The block grant school funding bill under consideration in the Kansas Legislature would hold districts harmless for enrollment declines due to school choice.
-

How do school choice programs affect budgets and performance of school districts?
Opponents of school choice programs argue the programs harm school districts, both financially and in their ability to serve their remaining students. Evidence does not support this position.
-

Wichita schools seek to rebrand
While poormouthing and suing taxpayers for more money, the Wichita school district wants to spend on a rebranding and marketing campaign.
-
Kansas newspapers against the children
A Kansas newspaper editorial illustrates that for the establishment, schools — the institution of public schools, that is — are more important than students.
-

WichitaLiberty.TV: Kansas school finance lawsuit, problems solved?
The Kansas Supreme Court handed down its ruling in Gannon v. Kansas, the school finance lawsuit. What did the court say, and did it address the real and important issues with Kansas schools?