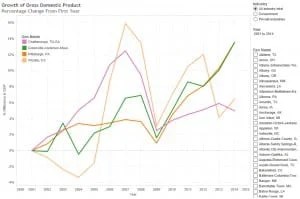
An interactive visualization of gross domestic product for metropolitan areas.
Gross domestic product is the sum of the value of all goods and services produced for a period of time. The Bureau of Economic Analysis makes this statistic available for metropolitan areas. GDP is not the only way to measure the economic health of a region, but it is one way. I’ve gathered the data and made it available in an interactive visualization.

Of note, recently James Chung delivered a lecture in Wichita. As part of the presentation, he mentioned three areas that he thought were doing things well: Cedar Rapids, Des Moines, and Omaha. A nearby illustration shows the visualization of the growth of GDP for these metro areas and Wichita. You can see that GDP for these areas have grown faster than has GDP for Wichita. (This visualization shows GDP change since the start of the chart, so that the growth of metro areas of different sizes can be compared.)

Click here to open the visualization in a new window.
Data is from Bureau of Economic Analysis, an agency of the United States Department of Commerce. Visualization created using Tableau.

Leave a Reply