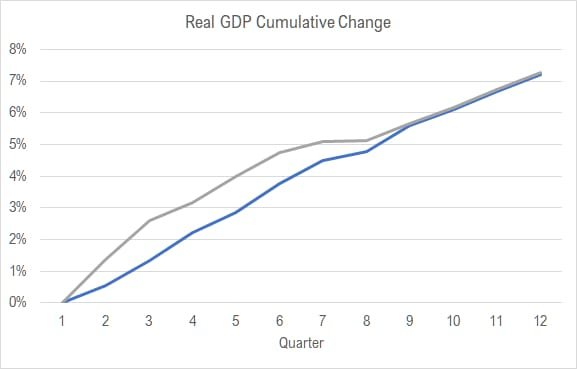
There is no doubt that the United States economy has grown since Donald J. Trump became president. How does the growth compare with the previous administration?
This chart holds plots of real gross domestic product (GDP) added over two periods of 12 quarters each. One line starts with the first quarter of 2017, the first quarter of the Trump administration. It ends with the fourth quarter of 2019.
The other line starts with the first quarter of 2014, which covers the last 12 quarters of the previous president’s administration.

Question. Which line belongs to each president’s administration?
No matter which administration’s line is blue and which is grey, I think the conclusion we can make is that one president did a good job of maintaining the positive trend of his predecessor, and that’s a great accomplishment.
This data is from Bureau of Economic Analysis, which is an agency of the United States Department of Commerce. This data is real GDP, meaning the dollar values are adjusted for the effects of inflation. The data is released quarterly, and it is not uncommon for the initial numbers to be revised. This is by far the most common source of GDP data for the United States and is extensively used.
