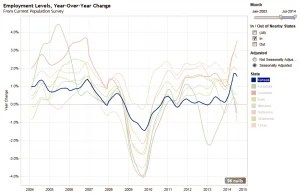
There are dueling claims and controversy over employment figures in Kansas and our state’s performance relative to others. I present the actual data in tables and interactive visualizations that you can use to make up your own mind.
(Let’s keep in mind that jobs are not necessarily the best measure of economic growth and prosperity. Russell Roberts relates an anecdote: “The story goes that Milton Friedman was once taken to see a massive government project somewhere in Asia. Thousands of workers using shovels were building a canal. Friedman was puzzled. Why weren’t there any excavators or any mechanized earth-moving equipment? A government official explained that using shovels created more jobs. Friedman’s response: ‘Then why not use spoons instead of shovels?’”)
It’s important to note there are two series of employment data provided by the U.S. Bureau of Labor Statistics, which is part of the U.S. Department of Labor. The two series don’t measure exactly the same thing. A document from BLS titled Employment from the BLS household and payroll surveys: summary of recent trends explains in brief: “The Bureau of Labor Statistics (BLS) has two monthly surveys that measure employment levels and trends: the Current Population Survey (CPS), also known as the household survey, and the Current Employment Statistics (CES) survey, also known as the payroll or establishment survey. … These estimates differ because the surveys have distinct definitions of employment and distinct survey and estimation methods.”

Another BLS document explains in detail the differences between the CPS and CES data. For example: CES: “Designed to measure employment, hours, and earnings with significant industrial and geographic detail” CPS: “Designed to measure employment and unemployment with significant demographic detail.”
Another difference: CES: “Self-employed persons are excluded.” CPS: “Self-employed persons are included.” (See Understanding the employment measures from the CPS and CES survey.)

Here is the visualization for Current Establishment Survey data, and here is visualization for Current Population Survey data.
Leave a Reply