The oil and gas boom in America boosts our competitiveness in the world economy while at the same time reducing carbon emissions, says economist Stephen Moore.
Moore recently left the Wall Street Journal to accept a position at Heritage Foundation as chief economist. He presented to an audience at a conference titled “The Tax & Regulatory Impact on Industry, Jobs & The Economy, and Consumers” produced by the Franklin Center for Government and Public Integrity.
A large portion of his presentation was on energy and its important role in the economy, and how radical environmentalists — the “green” movement — are harming our economy and people. An irony, he said, is that while President Barack Obama is in the “hip pocket” of radical environmentalists, he is presiding over the greatest oil and gas boom in American history. This boom is proceeding in spite of government, not because of it.
Moore emphasized the importance of energy costs to low-income people. Rising energy costs are like taxes on them, he said, while the wealthy can more easily absorb higher energy costs. “To be green is to be against capitalism, against progress, against poor people, against jobs.”
The boom in oil and gas production in America, made possible by horizontal drilling and fracking, is ahead of the rest of the world. While European countries have in the past embraced green energy technologies, these policies have failed, and the countries are retreating from them. Now, European countries want to use American drilling technologies, he said.
The lower electricity prices in America are a competitive advantage over Europe and China. German auto manufacturers are shutting plants in Europe and moving them to the United States, he said.
Of radical environmentalist groups. Moore said: “They don’t even care about global warming. If they really cared about global warming, they would be cheerleading fracking. Because fracking is making natural gas the new fuel for America. And guess what? Natural gas emits less carbon. It’s a great antidote to global warming.”
(According to the U.S. Energy information Administration, when generating electricity, coal emits from 2.08 to 2.18 pounds of carbon dioxide per kilowatt-hour electricity generated. Natural gas emits 1.22 pounds, or about 43 percent less carbon dioxide.)
Moore went on to tell the attendees that it is the United States that has reduced its carbon emissions the greatest amount in the last five years. He said this is remarkable in light of the fact that the U.S. didn’t sign the Kyoto Treaty, the U.S. didn’t implement cap-and-trade, and didn’t implement a carbon tax. “You would think these environmental groups would be applauding natural gas. Now these environmentalist groups have a new campaign called ‘beyond natural gas,’” he said.
Moore explained that at first, environmentalists said they could accept natural gas as a “bridge fuel” to solar power and wind. They were in favor of natural gas, he said, up until the time it became cheap and plentiful. Now, they are against gas. “My point is, the left and environmentalists are against any energy source that works.”
Over the past six years the U.S. has spent $100 billion promoting wind and solar power, but these two sources together account for just 2.2 percent of electricity generation. Even if the country were to quadruple the portion of electricity generated by these two renewable sources over the next 10 to 20 years, the nation would still need to get 90 percent of its electricity from other sources. Moore was doubtful that the country could quadruple the output from wind and solar.
Trends in carbon emissions
To further investigate the topics Moore raised, I gathered data from Global Carbon Atlas and prepared interactive visualizations using Tableau Public. You may access and use the visualizations by clicking here. Following are static excerpts from the visualizations. Click on each image for a larger version.

Looking at the amount of total carbon emissions, we see two important facts. First, after rising slowly, carbon emissions by the United States have declined in recent years. Second, carbon emissions by China are soaring. China surpassed the U.S. around 2005, and the gap between the two countries is increasing.

Note also that carbon emissions in India are rising. Emissions in most advanced economies are steady or falling. These trends are emphasized in the chart that shows carbon emissions for each country indexed from a common starting point. Emissions from China and India are rapidly rising, while emissions from countries with advanced economies have risen slowly or have declined.

A chart that shows the carbon emissions efficiency of countries, that is, the carbon emitted per unit of GDP, shows that in general, countries are becoming more efficient. Advanced economies such as the U.S., Japan, and Germany have an advantage in this metric. These countries emit about one-fourth as much carbon per unit GDP as does China.

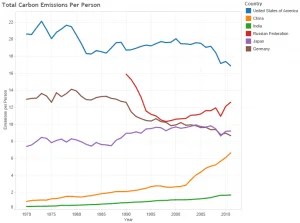
The chart of carbon emissions per person in each country show that the United States leads in this measure. In 2011, the U.S. emitted about 17 tons of carbon dioxide per person. China was at 6.6, and India at 1.7. But, the trend in the U.S. is downward, that is, less carbon emitted per person. In China and India, the trend is up, and rising rapidly in China.