Category: Wichita and Kansas schools

  • KPERS payments and Kansas schools

    KPERS payments and Kansas schools

    There is a claim that a recent change in the handling of KPERS payments falsely inflates school spending. The Kansas State Department of Education says otherwise.

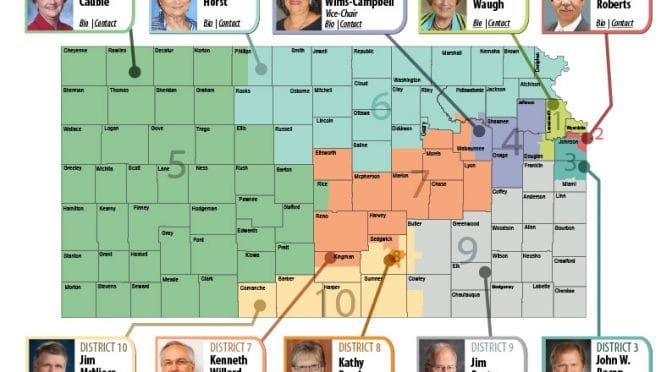
    A member of the Kansas State Board of Education has written an article that has received widespread attention. But the member, Jim Porter, is wrong on several accounts.

    In his article, Porter stated that a recent change in the handling of Kansas Public Employees Retirement System (KPERS) contributions falsely inflates school spending.1

    This is a standard argument of Kansas public school spending advocates, which is that because of a change in the way teacher retirement funds (KPERS contributions) are handled, it looks like the state is spending more on schools, when in fact it is not.

    In response, Kansas Policy Institute noted this: “According to Dale Dennis, KPERS funding was last sent directly to KPERS in 2004; it has since been sent directly to school districts included in reported school funding totals.”2

    Here, Dale Dennis contradicts Porter. Dennis is Deputy Commissioner at Kansas State Department of Education and head of Fiscal and Administrative Services.

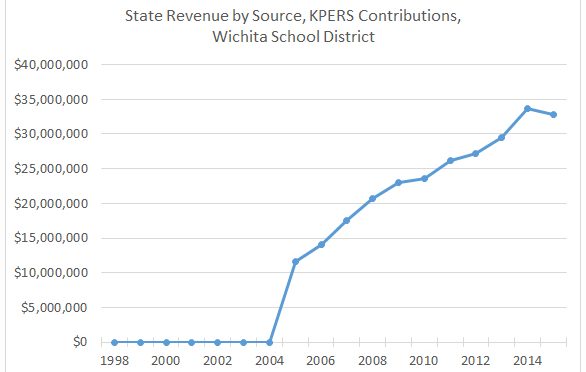
    Wichita Public Schools, State Revenue by Source, KPERS ContributionsEven though Dennis is the state’s top education finance official, we don’t have to rely solely on him to illustrate Porter’s error. Information from the Wichita public school district3 shows the same. Here I’ve plotted the funding sent by the state of Kansas to USD 259 for KPERS contributions. As Dennis indicated, in 2005 the Wichita school district started receiving money from the state for KPERS. Prior to that year it received none.

    Trabert’s article explains other ways in which Porter is wrong. I have to wonder what is the underlying reason for Porter writing things like this. Is he being told incorrect information or is he simply lying?


    Notes

    1. “Deception #2 – Until recently the state contribution to the Kansas Public Employees Retirement System (KPERS) was sent directly to KPERS. Now the funds are transferred to the public school account and then transferred to KPERS on the same day. Again, this was lauded as an increase to public school funding even though it was the same amount of money with just an additional transfer from the State of Kansas to the school to KEPRS.” Jim Porter for Kansas State Board of Education – District 9 Facebook post. Available at www.facebook.com/JimPorterKSBOE9/posts/1001536676582800.
    2. “Jim Porter’s Deception #2 – According to Dale Dennis, KPERS funding was last sent directly to KPERS in 2004; it has since been sent directly to school districts included in reported school funding totals. Again, Mr. Porter doesn’t define “recently” but most people would take it to mean within the time frame he references (the Brownback administration) and that clearly is not the case.” Trabert, Dave. State school board member should practice what he preaches. Available at kansaspolicy.org/state-school-board-member-practice-preaches/.
    3. USD 259 Comprehensive Annual Financial Report for 2015, State Revenue by Source, Governmental Funds, and USD 259 Comprehensive Annual Financial Report for 2007, State Revenue by Source, Governmental Funds.
  • Wichita school spending

    Wichita school spending

    Spending by the Wichita public school district, adjusted for inflation and enrollment.

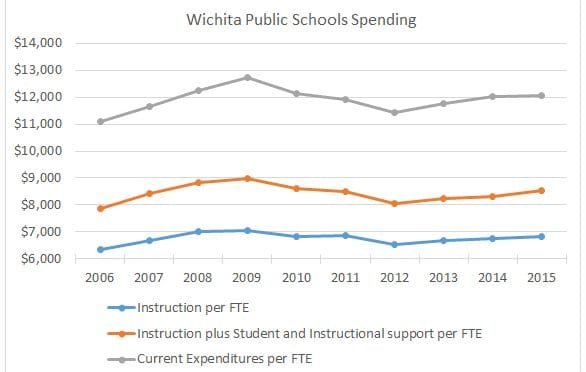
    Has spending by the Wichita public school district risen or fallen? A nearby chart shows recent spending figures. These figures are expressed on a per-student basis using full-time equivalent enrollment, adjusted to reflect changes in the consumer price index.

    Wichita school district, selected spending statistics. Click for larger.
    Wichita school district, selected spending statistics. Click for larger.
    (Current expenditures do not include facility acquisition and construction service, debt principal retirement, interest expense, and other expense. Over the past ten years, total expenditures per student have averaged $2,219 per year more than current expenditures.)

    Should anyone want to politicize these figures, note that the years of decline were under a Democratic governor and a one cent per dollar sales tax increase. For the past three years, these three measurements of spending have risen each year.


    Spending data is from USD 259 Comprehensive Annual Financial Report for 2015, Miscellaneous Statistics, page 122.
    Enrollment data from Kansas State Department of Education, available at http://www.ksde.org/Portals/0/School%20Finance/data_warehouse/total_expenditures/d0259exp.pdf.
    Data adjusted for inflation using Consumer Price Index for All Urban Consumers, U.S. Bureau of Labor Statistics.

  • Wichita school district spending on administration

    Wichita school district spending on administration

    Could the Wichita public school district reduce spending on administration to previous levels?

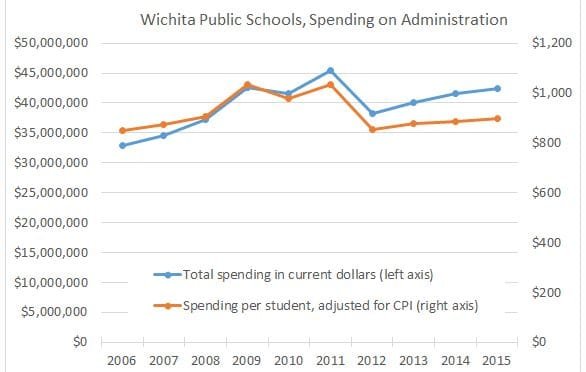
    In fiscal 2006 (the school year ending in 2006), the Wichita public school district spent $32,799,723 on administration. The amount rose and fell and rose again, with the district spending $42,353,120 in 2015.

    Wichita school district spending on administration. Click for larger.
    Wichita school district spending on administration. Click for larger.
    If we express these figures on a per-student basis and adjust them for inflation, the district spent $851 in 2006, and $896 in 2015. Like spending in total dollars, that figure rose, then fell, and then rose again.

    Could the Wichita public school district cut administration spending to 2006 levels, on a per-student, inflation-adjusted basis?

    If the district could do this, that would reduce costs by $45 per student. With FTE enrollment for 2015 at 47,254.4, the district could save $2,126,448. Or it could use those savings to offset reductions in spending in other areas.

    It’s up to the Wichita school district to decide.


    Spending data is from USD 259 Comprehensive Annual Financial Report for 2015, Miscellaneous Statistics, page 122.
    Enrollment data from Kansas State Department of Education, available at http://www.ksde.org/Portals/0/School%20Finance/data_warehouse/total_expenditures/d0259exp.pdf.
    Data adjusted for inflation using Consumer Price Index for All Urban Consumers, U.S. Bureau of Labor Statistics.

  • Wichita student/teacher ratios

    Wichita student/teacher ratios

    Despite years of purported budget cuts, the Wichita public school district has been able to improve its student/teacher ratios.

    When discussing school funding, there is controversy over how spending should be measured. What funds are included? Is KPERS included? Should we adjust for enrollment and inflation? What about bond and interest funds and capital outlay?

    The largest expenditures of schools — some 80 percent nationwide — is personnel costs. In Kansas, and Wichita in particular, we’re told that budget cuts are causing school class sizes to increase.

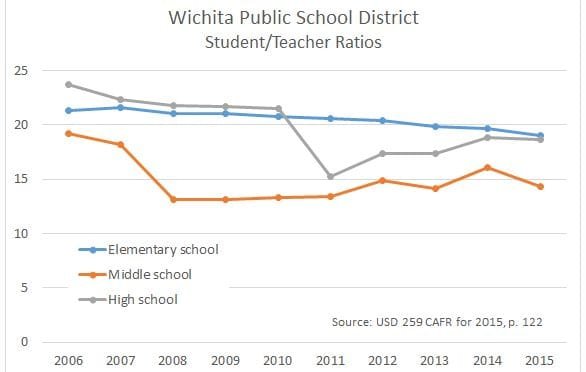
    When we look at numbers, we see that the Wichita school district has been able to reduce its student/teacher ratios substantially over the last ten years. (Student/teacher ratio is not the same statistic as class size.) There have been a few ups and downs along the way, but for all three school levels, the ratios are lower than they were ten years ago, and by substantial margins.

    This means that Wichita schools have been able to increase employment of teachers at a faster rate than enrollment has risen.

    So however spending is categorized in funds, whether KPERS contributions are included or not, whether the funding comes from state or local sources, whether spending is adjusted for inflation, the Wichita school district has been able to improve its student/teacher ratios.

    Data is from USD 259 Comprehensive Annual Financial Report for 2015, Miscellaneous Statistics, page 122, and CAFR from other years.

    Wichita Public School District, Student Teacher Ratios, through 2015
    Wichita Public School District, Student Teacher Ratios, through 2015
  • Kansas state school board member should practice what he preaches

    Kansas state school board member should practice what he preaches

    By Dave Trabert, Kansas Policy Institute.

    District 9 Kansas State School Board member Jim Porter published the following piece outlining what he considers to be deceptive statements about school funding and state taxes. He urges political leaders to “tell the whole story” but doesn’t practice what he preaches, as we found a dozen deceptive statements in his piece.

    We are consistently hearing from those political leaders who are resisting what many of us consider to be the adequate funding of education that Schools are receiving more state support than ever and that support is increasing every year. Typically they say that people need to know the facts. Well, that is part of the story and although not a false statement it is certainly deceptive. I will make an attempt to explain the part of the story that they are not telling.

    Continue reading at Kansas Policy Institute.

  • Kansas public education factbook

    In debates over school funding and performance in Kansas, facts are often in short supply. Here is a compilation.

    Kansas Policy Institute has release a new edition of its annual compilation of data regarding Kansas schools. On the importance of this data, KPI Vice President and Policy Director James Franko wrote, “Numerous scientific surveys show that citizens are grossly misinformed on many pertinent facts of public education in Kansas. Aid and spending per-pupil are much higher than many Kansans believe, and student achievement is lower than understood. This fact book series aims to rectify this situation.”

    As to the source of data, KPI writes “Aside from ACT scores, the data in this Fact Book all come from official government sources, including local school districts, the Kansas Department of Education (KSDE) and the U.S. Department of Education.”

    Access the factbook here.

  • Kansas continues to snub school choice reform that helps the most vulnerable schoolchildren

    Kansas continues to snub school choice reform that helps the most vulnerable schoolchildren

    Charter schools benefit minority and poor children, yet Kansas does not leverage their benefits, despite having a pressing need to boost the prospects of these children.

    The CREDO studies at Stanford University are often cited as the most comprehensive and reliable research on charter schools. Opponents of charter school focus on a finding that some charter schools are worse than local traditional public schools, the figures being 19 percent for reading and 31 percent for math. Because of this, opponents of charter schools feel justified in keeping them out of Kansas. (Kansas does allow charter schools, but the law is so stacked against charter schools that there are very few, effectively none.)

    The findings from the Stanford CREDO National Charter School Study from 2013 contain much more information than this simple conclusion. In particular, here is a partial quote from its executive summary: “Enrollment and persistence in charter schools is especially helpful for some students, particularly students in poverty [and] black students …”

    Why would we not want to experience these benefits, especially for poor and minority students?

    This is important. While the Kansas public education establishment touts the state’s relatively high performance on national tests, when results are analyzed closely, we see some things that should cause all Kansans to embrace whatever we can do to correct this.

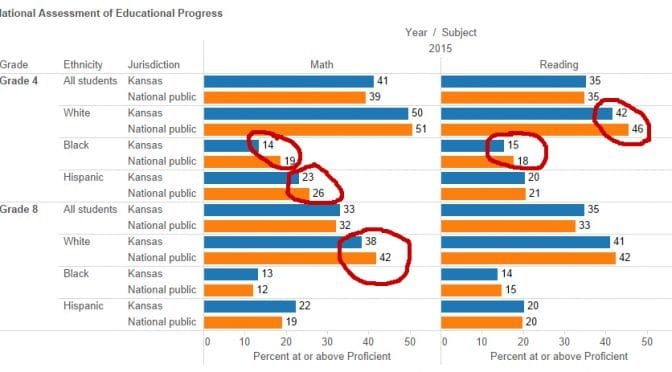
    Kansas students compared to national. Click for larger.
    Kansas students compared to national. Click for larger.
    Nearby is a chart of NAEP scores for Kansas and national public schools. It is an example from a visualization of NAEP scores that you may use yourself. I’ve circled some troubling results. An example of something that must be changed is this: For grade four math, 14 percent of Kansas black students are at the level “proficient” or better. For national public schools, the figure for the same population subgroup is 19 percent.

    Following, some findings from the CREDO study that show how charter schools help precisely the students that need the most help. But the Kansas school establishment does not want charter schools, and so far Kansas Republicans — including Governor Brownback and legislative leaders — have been unwilling to help the most vulnerable Kansas schoolchildren.

    “The 27 states in our study provide the widest angle view of the charter school sector to date. Across multiple measures, the students in these charter schools have shown both improved quality over the results from 2009 and an upward trend in their performance over the past five years.”

    “The average charter school student now gains an additional 8 days of learning each year in reading, compared to the loss of 7 days each year reported in 2009. In math, charter students in 2009 posted 22 fewer days of learning; now that gap is closed so their learning each year is on par with their peers in traditional public schools.”

    “Looking back to the demographics of the charter school sector in the 27 states, charter school enrollment has expanded among students in poverty, black students, and Hispanic students. These are precisely the students that, on average, find better outcomes in charter schools. These findings lend support to the education and social policies that focus on education as the mechanism to improve life chances for historically underserved students. Charter schools are especially beneficial learning environments for these students, as the following graphics illustrate in greater detail.”

    “Enrollment and persistence in charter schools is especially helpful for some students, particularly students in poverty, black students, and English language learners all of whom post significantly higher learning gains in both reading and math. Hispanic students are on par with their TPS peers in both reading and math. For students with multiple designations (such as being black and in poverty), the impacts of charter schooling are especially positive and noteworthy.”

  • Kansas school salaries

    Kansas school salaries

    Kansas school salaries for superintendents, principals, and teachers presented in an interactive visualization for each district, updated for 2016 data.

    Recently Kansas Policy Institute noted the discrepancy in salary increases for Kansas public school management as compared to teachers. See Pay raises to superintendents and principals far outpace those to teachers.

    In the article, David Dorsey writes: “A widely-shared solution to improving student outcomes is to put more money in the classroom. What does it say about the importance of student achievement to local school boards and administrations when pay increases are disproportionately higher to those who are not in the classroom?”

    And later: “Much has been documented about teacher shortages, especially due to those leaving after only a few years in the profession. One way to reverse that trend would be for districts to make spending choices that would support the commitment to keeping quality teachers.”

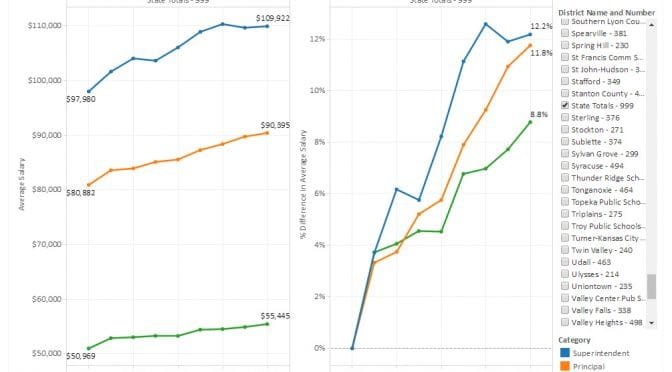
    Kansas State Department of Education has released salary figures for districts for the current school year, fiscal year 2016. Statewide, since 2008, the KSDE data shows these cumulative salary increases:

    Superintendents: 12.2 percent
    Principals: 11.8 percent
    Teachers: 8.8 percent

    If we start the comparison in 2009 the difference is larger, with increases of 8.2 percent for principals and 4.9 percent for teachers.

    It’s also useful to look at individual districts. For example, for the Wichita public school district, there are these cumulative salary increases since 2008:

    Superintendent: 53.9 percent
    Principals: 7.0 percent
    Teachers: 2.3 percent

    The Wichita district has just one superintendent, so no matter how much the salary rises, it’s still the salary for just a single person and has a negligible effect on total district payroll costs. There are, however, 89 principals, so the increase for this category of employee matters much more.

    But you have to wonder: What about the teachers?

    I’ve gathered the data and present it in an interactive visualization. You may select any single district, or use district 999 for statewide totals. Click here to open the visualization in a new window. Data is from Kansas State Department of Education. Figures include fringe benefits and are not adjusted for inflation. Visualization created using Tableau Public. There are several missing values which can make the percentage change invalid for a single year.

    Kansas school salaries. Click for larger.
    Kansas school salaries. Click for larger.
  • At Pachyderm: Kansas Legislature education chairs to speak

    At Pachyderm: Kansas Legislature education chairs to speak

    This week (April 15, 2016) the Wichita Pachyderm Club features Kansas Representative Ron Highland (Chair, House Education Committee) and Kansas Senator Steve Abrams (Chair, Senate Education Committee). Their topic is “A report from the House and Senate Education Chairmen on the 2016 Legislative Session.”

    A new school finance bill has been introduced. Undoubtedly it will be a major topic. Background on this bill is here:

    Kansas Legislature: HB 2741, Creating the school district finance and student success act. Contains the text of the bill.

    Wichita Eagle: New proposal for Kansas school finance formula sparks worries

    Kansas Policy Institute: Kansas Legislature Introduces Transformative New School Funding System.

    Kansas Association of School Boards: Summary of HB 2741.

    The Wichita Pachyderm Club is a friendly club. Everyone is welcome to attend meetings. The meeting cost, which includes a delicious buffet lunch plus coffee and/or iced tea, is $15 ($12 for Pachyderm Club members). This event is held in the Wichita Petroleum Club, located on the top floor of the Ruffin Building at 100 N. Broadway. You may park in the garage on Broadway, and if you do, bring your parking ticket to have it stamped for $1.00 parking.