Category: Wichita and Kansas schools

  • Rally for school choice in Kansas

    Rally for school choice in Kansas

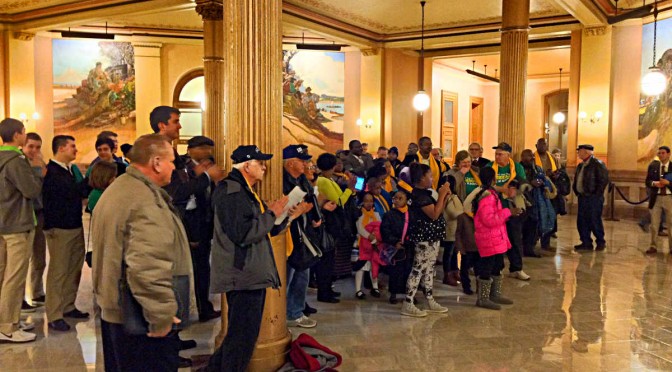
    This month, parents and children from around Kansas rallied in the Kansas Capitol for school choice.

    Speakers included James Franko of Kansas Policy Institute. He told the audience that children deserve better than what they are getting today. For many, he said that might be in a public school, but for many others it may be in a private school. Parents and their children should make that decision. It shouldn’t be based on their zip code. Individuals, not institutions, should be the focus.

    Kansas now has a private school choice program. Franko told the audience that newspaper coverage of this program emphasizes how it helps private schools and hurts public schools. But we should be reading stories about how school choice helps kids, giving each child the freedom and opportunity to find the best educational fit. He explained that school choice also helps the students who remain in public schools, referring to a Friedman Foundation for Education Choice study. “It’s about helping every single child,” he said.

    The study Franko mentioned is A Win-Win Solution: The Empirical Evidence on School Choice. In its executive summary, author Greg Forster, Ph.D. writes “Opponents frequently claim school choice does not benefit participants, hurts public schools, costs taxpayers, facilitates segregation, and even undermines democracy. However, the empirical evidence consistently shows that choice improves academic outcomes for participants and public schools, saves taxpayer money, moves students into more integrated classrooms, and strengthens the shared civic values and practices essential to American democracy.”

    Later, the specific finding that Franko used in his talk: “Twenty-three empirical studies (including all methods) have examined school choice’s impact on academic outcomes in public schools. Of these, 22 find that choice improves public schools and one finds no visible impact. No empirical study has found that choice harms public schools.

    Michael Chartier of the Friedman Foundation for Education Choice said that there are now 51 school choice programs in 24 states plus the District of Columbia.

    School Choice Rally, Kansas Capitol 2015-02-02 15.07.38 HDRAndrea Hillebert, principal of Mater Dei Catholic School in Topeka told the audience that school choice benefits families, schools, and the state. Families can choose the learning environment that is best for their children, and are not penalized if they choose a school that is not run by the government. She told the audience that “school choice encourages — requires — families to take an active role in shaping their students’ future.” Schools benefit because consumer choice is a catalyst for innovating programming and continuous improvement. The state benefits from the increased achievement of students in non-public schools.

    Susan Estes of Americans for Prosperity – Kansas explained that even as a former public schoolteacher, it has been a challenge for her to navigate the school system so that the needs of her three children were met. She said that parents not only deserve, but have the right to be the primary decision maker for their children.

    Bishop Wade Moore, founder and principal of Urban Preparatory Academy in Wichita, completed the program. Urban Prep is a new private school in northeast Wichita, and students from that school attended the rally. He said that our legislators have “a moral responsibility to do what is right for each Kansas kid.” He mentioned the students that are pushed through the system until they graduate, but are unprepared for college, trade school, or employment. “A lot of those children have no chance at life. So we say that we have a crisis in this nation,” he said.

    Alluding to how Kansas has few school choice programs, Moore said “It’s time for us to wake up and move ahead, like the rest of the nation, in education reform.” He said that he heard a school superintendent make the statement that our children and parents have a choice in education. He said “They can choose one of our schools to attend.” That is not choice, Moore said. Real choice is when parents have the opportunity to go outside the public school system.

    The reason for the poor academic performance of many children is that their parents have not had choice and control over the children’s education. “It is imperative that all children, regardless of their race, gender, place of residence, and socio-economic status, learn the concepts and strategies necessary for them to develop and succeed,” he told the audience.
  • Better outcomes at a better price in Johnson County

    From Kansas Policy Institute.

    Better outcomes at a better price in Johnson County:

    USD 232 De Soto and USD 231 Gardner-Edgerton

    By Dave Trabert

    The most recent performance and spending records of Johnson County school districts serves as a good reminder that there is no relationship between high spending and high achievement. In fact, the two districts that spend the least happen to have the best outcomes on state assessments.

    Students who read grade-appropriate material with full comprehension and usually perform accurately on all grade-level math tasks are best positioned for success in college and career. Disparate demographic compositions and achievement gaps distort districts’ average scores, so student cohorts must be separately compared. De Soto and Gardner-Edgerton have the highest and second-highest percentages of income-based cohorts attaining these levels in Reading and Math and also spend the least per-pupil on current operations (no capital or debt included).

    The achievement gap for low income students is common across Kansas and there are also large variances in student body compositions across districts. For example, only 8.4% of Blue Valley students are considered low income (based on eligibility for free / reduced lunch) whereas as Shawnee Mission has 37.8% who qualify as low income; eligibility for free/reduced lunch is the official metric of “income” via the Kansas Department of Education. Blue Valley’s average score benefits from having very few low income students and masks the fact that other districts do as well or better on individual student groups.

    De Soto’s and Gardner-Edgerton’s superior performance has great significance for taxpayers. In fact, if the other five Johnson County districts operated at the per-pupil cost of De Soto, the burden on taxpayers could be reduced by $127.1 million! Of course, while De Soto has the lowest operating cost per-student, that doesn’t mean that the district is efficient; savings across the county would be even greater if De Soto’s costs were reduced through consolidation of non-instruction services across district lines and other efficiency opportunities.

    FY 2014 per-pupil spending for each Johnson County district is shown below by cost center. Click here to download these blog tables and per-pupil spending comparisons of all Johnson County school districts, showing how spending has changed since FY 2005.

  • Kansas school employees by type

    Kansas school employees by type

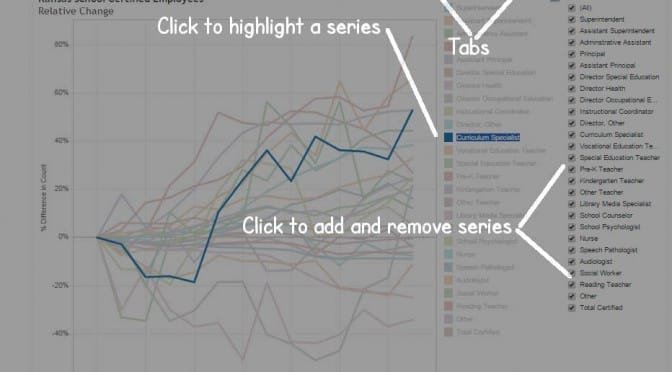
    An interactive visualization of relative trends in Kansas school employment.

    Kansas State Department of Education makes available tables of the number of employees working in Kansas schools. Employees are classified in two broad categories, Certified and Non-Certified. Within each category, employees are further classified by job type such as Superintendent, Curriculum Specialist, and Social Worker.

    Visualization of certified employees, showing Principals and Curriculum Specialists highlighted.
    Visualization of certified employees, showing Principals and Curriculum Specialists highlighted.
    I’ve gathered the tables back to fiscal year 2002 (the 2001 – 2002 school year) and present them in an interactive visualization. There are separate visualizations for Certified and Non-Certified employees. In each, as shown in the instruction, you may check the check boxes to add or remove types of employees. For the employee types that are shown, you may click to highlight types apart from the others.

    The line charts show the relative change in the number of employees. You may learn whether the number of employee type A is growing faster or slower than employee type B.

    The visualization also holds tables showing the number of employees.

    Click here to open the visualization in a new window.

    Using the visualization.
    Using the visualization.
  • What we can learn from the piano

    What we can learn from the piano

    The purchase of a piano by a Kansas school district teaches us a lesson. Instead of a system in which schools raise money voluntarily — a system in which customers are happy to buy, donors are happy to give, and schools are grateful to receive — we have strife.

    A Kansas City, Kansas school has spent $48,000 to purchase a new piano, replacing one in use for many years. Critics of school spending, even Governor Brownback, point to this as an example of school spending out of control. How can schools want more money, they say, if one school can spend $48,000 on a piano?

    We can learn a few things about our public schools from this.

    Piano piano-558452_1280First, there is no way to tell whether this purchase was wise. There are several reasons. First, the school is not spending its own money. The school is spending other people’s money, and in a near vacuum. It’s spending in circumstances that are not amenable to wise purchases. Milton Friedman has developed a grid of the ways that money may be spent. The purchase of the piano falls into category III, which is spending someone else’s money on yourself.

    Second, the school is spending this money in an uncompetitive environment. In Kansas, the public schools have a near-monopoly on the use of public funds for schools. No matter how bad the public schools may be, not matter how wasteful of funds, public schools know that parents have few alternatives. Yes, there are private schools in Kansas, but if parents choose them, they still have to pay the public schools. Who else can do that?

    Competition is important because it provides accountability. It provides a framework for making decisions about the allocation of resources. If we see, say, a grocery store spending lavishly on fixtures and furnishings, we may surmise that the store is trying to attract customers. The ultimate test of the strategy is profit. Do customers appreciate the store’s investment enough to shop there? If so, profits may be earned. If not, there will be losses, and store management has learned a lesson.

    Similarly, if Kansas public schools faced meaningful competition for students, schools would have a framework for making spending decisions, as well as for making many other decisions. But with no meaningful competition, Kansas schools are operating in the dark. They do not have the benefit of market competition and profit to let them know if they are making wise decisions as to the allocation of resources.

    Market competition is not competition like a life-and-death struggle in the jungle or sea, where the winners eat the losers. It is also not a contrived event, as is a sporting event. Instead, market competition refers to a discovery process, where through mountains of voluntary transactions we learn what works and what doesn’t. We don’t have that learning process in Kansas public schools.

    Kansas City school district spending. Click for larger version.
    Kansas City school district spending. Click for larger version.
    The purchase of the piano has also stimulated much rancorous debate. People are yelling at each other, and over the education of children. Instead of fighting and strife, we should be celebrating children, schools, and education. But that’s not the way government works. Money is taken through taxes. (I realize it’s considered impolite in some circles to say this, but taxes are taken by the threat of force.) Then tax money is spent by people who pretty much say “screw you” to taxpayers. That is the tone of an article written by the superintendent of the school district that bought the piano. The real problem, she contends, is that the people of Kansas are not taxed enough.
    Employment ratios in Kansas City schools. Click for larger version.
    Employment ratios in Kansas City schools. Click for larger version.
    No matter that spending per student in this school district is $15,388. That’s down from 2009 when it nearly touched $18,000, but much higher than the early years of this century when it was around $11,000. (These are inflation-adjusted, per student figures.) Employment ratios in this district have improved, and unspent fund balances, not including bond and capital funds, have risen.

    Unspent funds in Kansas City schools, not including bond and capital. Click for larger version.
    Unspent funds in Kansas City schools, not including bond and capital. Click for larger version.
    Despite these improvements, the Kansas City school superintendent says Kansans do not pay enough taxes to her schools. I get the sense that she wants to fight for more.

    Do we fight over which grocery store is best? Do we fight over how much to spend on building and operating grocery stores? No. People peacefully and freely choose the store they like. Sometimes they choose several stores at the same time.

    Civil society is dying. Instead of a system in which schools raise money voluntarily — a system in which customers are happy to buy, donors are happy to give, and schools are grateful to receive — we have strife. Instead of a Kansas school superintendent saying “thank you” to taxpayers for the new piano and $15,388 to spend each year on each student, we have something else. We have the gnashing of teeth, and that’s a shame.

  • How do school choice programs affect budgets and performance of school districts?

    How do school choice programs affect budgets and performance of school districts?

    Opponents of school choice programs argue the programs harm school districts, both financially and in their ability to serve their remaining students. Evidence does not support this position.

    If school choice programs — charter schools, vouchers, or tax credit scholarships — harmed the existing public schools, it would be a reasonable argument against school choice. Especially if the students who remain in public schools had less of an opportunity to learn.

    The prevalent argument is that charter schools and other public school alternatives drain funds from public schools. That is, if a public school student chooses a charter or private school, and if the money follows the student to the other school, the public school district loses money that it otherwise would have received. Therefore, the public school district is worse off, and so too are its students.

    A rebuttal is that since a public school has shed the responsibility for schooling the student, its costs should fall correspondingly. This would be true if all the costs of a public school are variable. Some costs are fixed, however, meaning they can’t be adjusted quickly — in the short run, that is. An example is the cost to maintain a classroom. If a school has one less student than the year before, it still requires the same support for utilities. One or several fewer students doesn’t mean that fewer teachers are needed.

    Public schools and their lobbyists, therefore, argue that school choice programs are a financial burden to public schools. Under school choice programs, they say, public schools lose students and their accompanying funding, but the public schools retain their fixed costs.

    The Fiscal Effects of School Choice Programs on Public School Districts (cover)The question, then, is what portion of a school’s costs are variable, meaning costs that schools can adjust quickly, and what portion are fixed, meaning they can’t be adjusted quickly? Benjamin Scafidi, professor of economics at Kennesaw State University, has examined schools looking for the answer to this question. His paper The Fiscal Effects of School Choice Programs on Public School Districts, published by The Friedman Foundation for Educational Choice, holds answers to these questions.

    The first question is this: What is the relation of school choice programs to school districts’ variable costs? Scafidi has endeavored to determine the breakdown between variable and fixed costs in each state. In Kansas, for the 2008 – 2009 school year, total spending per student was $11,441. Of that, Scafidi estimates $3,749, or 32.8 percent, were fixed costs. Variable costs were $7,692, or 67.2 percent. Since then spending has risen, but there’s no reason to think the allocation of costs between fixed and variable has changed materially. For the school year ending in 2014 total spending per student was $12,960. That implies fixed costs per student of $4,251 and variable costs per student of $8,709.

    Now, how much money would a public school lose if a student chose, say, a private voucher school under a voucher program? In Kansas we don’t have vouchers for school choice, so we can’t answer the question directly. We do know that base state aid per pupil in Kansas is $3,852. That is the starting point for state spending per student.

    In a recent presentation on this topic, Scafidi said: “Any school choice program where about $8,000 per student or less, on average, follows the child to the school of his or her choice, improves the fiscal situation of the public school district, on average, and students who remain in public schools have more resources available for their education.”

    A typical Kansas school district, therefore, with variable costs of $8,709 per student, has its fiscal situation improved when it loses a student and its $3,852 in state funding.

    Kansas School Finance Formula, from Kansas Policy Institute, August 2014
    Kansas School Finance Formula, from Kansas Policy Institute, August 2014
    Many Kansas students, however, trigger much more funding due to weightings that compensate for the purported higher costs of some situations. The largest weighting in Kansas, based on numeric magnitude, is the at-risk weighting. It adds 45.6 percent to base state aid. So if a Kansas public school loses such a student and weighting, it loses $5,608 in funding. That is far less than its variable costs of $8,709. State funding for Kansas schools in the 2013 to 2014 school year was $7,088 per student, still less than school districts’ variable costs.

    I asked Scafidi what is the dividing line between variable and fixed costs? The answer is that within two or three years, schools should be able to adjust their fixed costs to be in line with their needs. This is in line with the economic and accounting reality that says in the long run, all costs are variable.

    Can school districts adjust their costs quickly in response to changing enrollments? This may be a problem for the very smallest districts, those with just one or two teachers per grade, Scadifi concedes. In his paper, Scafidi illustrates two examples of districts in Georgia with just over 1,000 students making adjustments. In Kansas, there are 286 school districts. Of these, 207 have enrollment of less than 1,000 students, but only 20 percent if the state’s students are in these small districts.

    School districts often dispute the contention that they are able to reduce their variable costs rapidly in response to enrollment changes. Scafidi notes that if school districts say they cannot reduce costs when they lose students, the implication is that all of their costs are fixed. If true, then schools should not receive additional funding when enrollment rises. After all, if all their costs are fixed, costs do not change with enrollment — either up or down.

    We have seen that school choice programs do not harm the finances of local school districts. The second question concerns the quality of education for the students who remain in public schools.

    To answer this question, we must recognize the wide variation of teacher efficacy. Some are very good, and some very poor. Further, the difference between good and bad is large. Eric A. Hanushek and others have found that very good teachers routinely produce 1.5 years of gain in achievement during an academic year. Bad teachers produce 0.5 years of gain. If a student is unfortunate enough to experience ineffective teachers two or three years in a row, the student may be so far behind as to never catch up.

    What does this have to do with school choice programs? If public schools have to downsize due to students lost for any reason — including school choice programs — this gives public schools an opportunity to shed their least effective teachers. This means that students who remain in public schools have a higher likelihood of experiencing the most effective teachers.

  • WichitaLiberty.TV: Kansas school employment and spending

    In this excerpt from WichitaLiberty.TV: What is the trend in Kansas school employment? Then, what do citizens know about Kansas school spending? Finally, what did Milton Friedman have to say about private vs. government spending? View below, or click here to view at YouTube. Originally boradcast November 23, 2014.

    Mentioned in this excerpt:
    Are Kansas classroom sizes growing?, Kansans still uninformed on school spending, and Friedman: The fallacy of the welfare state

  • Kansas school funding controversy is about entitlement, not need

    From Kansas Policy Institute.

    School funding controversy is about entitlement, not need
    By Dave Trabert

    When every Johnson County school district qualifies as a property-poor district, you know you have a broken school funding formula … and a controversial claim based on entitlement.

    The Kansas Legislature authorized $134 million in school funding this year in a good-faith effort to resolve the Supreme Court equity finding in Gannon v. State of Kansas. Most of the increase, $109 million –- was for Supplemental General State Aid (SGSA), which equalizes Local Option Budgets for property-poor districts.  The other $25 million was for equalization of Capital Outlay aid.

    Kansas Judicial Center
    Kansas Judicial Center
    You wouldn’t know it from most media coverage, but the Supreme Court ruling on equity provides the Legislature with broad latitude in resolving wealth-based disparity, and does not require specific funding levels. “We agree that the infirmity can be cured in a variety of ways — at the choice of the legislature. And the legislature should have an opportunity to promptly cure. Any cure will be measured by determining whether it sufficiently reduces the unreasonable, wealth-based disparity so the disparity then becomes constitutionally acceptable, not whether the cure necessarily restores funding to the prior levels.

    The Legislature didn’t have to increase SGSA in order to satisfy the Supreme Court ruling on LOB equity, but they did so anyway. The $109 million authorized was based on calculations from the Kansas State Department of Education, but KSDE underestimated the amount by which districts would increase their Local Option Budgets, and now school districts want another $36 million from taxpayers. Districts want this money because the formula says they are entitled to it. But there is ample evidence that more money is not needed, and now SB 71 has been introduced into Senate Ways and Means Committee to revise the equalization formula and eliminate the $36 million increase.

    SB 71 is opposed by school districts, but it is a necessary fix to a broken formula and frankly, districts don’t need the extra money.

    The intention of SGSA is to offset wealth-based disparity among school districts, but calculations from the Kansas Department of Education has the current formula allocating $54.8 million to districts in Johnson County –- the state’s wealthiest county. Every district in Johnson County is considered a “property-poor” district under the current formula, including Blue Valley, which may be the most affluent district in Kansas.

    Johnson County schools are being subsidized by taxpayers in far less affluent parts of Kansas under the current formula. One additional mill of property tax levied in the Blue Valley district raises $2.3 million; one mill raises $2.9 in Shawnee Mission and $1.7 million in Olathe. But taxpayers in counties where one mill generates less than $50,000 are being asked to subsidize property-rich districts; those counties include Cheyenne, Clark, Edwards, Ellis, Gove, Gray, Greeley, Kearny, Kiowa, Lane, Logan, Ness, Reno, Rice, Rooks, Rush, Russell, Stafford, Thomas, Trego and Wallace. One or more districts in those counties are considered ineligible for equalization aid by the current formula, but those districts’ patrons are expected to subsidize urban districts in Johnson County, Sedgwick County, Shawnee County and Wyandotte County –- just to name a few.

    On the issue of need, the K-12 Commission on Student Achievement and Efficiency heard testimony from school districts, regional service centers and others recently, confirming that school districts could operate much more efficiently. However, school districts made it very clear that they are strongly opposed to being required to make efficient use of taxpayer money. Legislative Post Audit also told the Commission that districts have not enacted many of their recommendations to reduce the cost of services.

    There is also no need to increase equalization of Capital Outlay aid. The $25 million allocated for this year was based on Capital Outlay property taxes levied by school districts last year, but districts increased local property taxes even more, entitling them to $20 million more in Capital Outlay equalization. This is another example of a broken school funding formula, as it has nothing to do with need. School districts began this year with a record $434.9 million set aside for Capital projects. Capital Outlay reserves are completely separate from capital projects related to bond issues and have increased each year since 2005. Districts may feel entitled to even more money for capital projects but there is no need to further pump up their reserves.

    The equalization system and the entire entitlement-based school funding system need to be replaced with a student-focused and taxpayer-focused perspective.

  • Judicial panel used cherry-picked data in Gannon decision

    Judicial panel used cherry-picked data in Gannon decision

    From Kansas Policy Institute.

    Judicial panel used cherry-picked data in Gannon decision

    By David Dorsey

    (w)e conclude that the Kansas K-12 school finance formula still stands as constitutionally inadequate by its failure to assure and implement adequate funding to meet and sustain a constitutionally adequate education as a matter of sound expert opinion from those with relevant and reliable expertise and experience with the Kansas K-12 school system.(emphasis added)

    Thus is the opinion, filed December 30, 2014, from the Shawnee County District Court three-judge panel as tasked by the Kansas Supreme Court pursuant to their decision in Gannon v. Kansas in March of 2014.

    We reported in a previous KPI blog that the unspecified underfunding of K-12 public education in Kansas identified in this decision is at least $548 million. The judges based their opinion on several categories of adequacy they deemed relevant to the case. One such category in the decision is entitled Adequacy As A Matter Of Student Performance (pp. 20-48). The judges included as its linchpin evidence an interview with Kansas City, Kansas USD 500 superintendent Dr. Cynthia Lane. Dr. Lane provided testimony regarding how a federal grant enabled Emerson Elementary, a USD 500 school, to significantly increase student performance.

    In short, Emerson Elementary is a small K-5 school. Several years ago, it gained notoriety for being declared the lowest performing elementary school in Kansas. As such, it was awarded a School Improvement Grant (SIG) from KSDE, authorized by the No Child Left Behind law. The school was given nearly $3 million over a three-year period (2010-11 to 2012-13 school years) to improve state assessment test scores. Dr. Lane testified that “fewer than 30 percent” of the students met state standards in math and reading prior to receiving the grant. According to demographic data published by KSDE, Emerson has about 95% economically disadvantaged students. While Dr. Lane testified that Emerson is ethnically “about 50 percent African American and about 48 percent Hispanic,” KSDE reported that the ethnic breakdown is about two-thirds Hispanic, one-quarter African American and less than 10% white. She told the court that over the life of the grant Emerson’s students performed “on both the reading and math state assessment to have more than 85 percent … meeting or exceeding expectations just in the last three years. It’s a remarkable story.”

    Apparently the court agreed, afforded to say:

    Given the continuing grade advancement and migration upwards of K-12 schoolers during their school careers, it seems but obvious that for educational advancement, much less the maintenance of results accomplished prior with the earlier funding initiatives implemented, but now abandoned, that the revenue streams which supported those results in that period of favorable funding needed to be continued to be provided in order to properly educate the continuing stream of new faces going forward, either initially entering the school system or advancing in grade. No evidence or proffer of evidence supports otherwise. (pp. 39-40, emphasis not added)

    Translated: More money = greater student achievement, and there is no evidence to the contrary.

    I will now proffer contrary evidence, a much less remarkable story that should have been proffered in the original court case: Northwest Middle School.

    The same year Emerson Elementary was awarded its SIG, another USD 500 school, Northwest Middle School, was awarded a similar grant with a higher amount of $4.77 million. Northwest has similar minority and economically disadvantaged populations to Emerson Elementary (just over half African American and just over one-third Hispanic and 98% low income). But the outcomes pursuant to the SIG were very much dissimilar, indeed.

    The following table and the accompanying graph show how Northwest Middle School scored on the state reading and math assessments for the three years prior to receiving the SIG and during the three-year implementation of the grant.

    Northwest Middle school from KPI 2015-01

    As the graphics show, achievement at Northwest had an uptick in both math and reading the first year of the grant, but then fell off dramatically the following two years. To put their performance in perspective the following graphs compare Northwest to Rosedale Middle School (the USD 500 school most comparable to Northwest according to KSDE) and the USD 500 district as a whole.

    Northwest and Rosedale from KPI 2015-01

    In reading, Northwest underperformed both Rosedale (which did not get a SIG) and the district as a whole both prior to and after receiving the grant. The trend and gap between Northwest and Rosedale remained amazingly consistent throughout this period. The picture in math is a little different. Northwest students maintained a slight advantage over Rosedale throughout the grant period and nearly eliminated the gap with the district as a whole. However, the overall trend is downward, with just over 40% of the Northwest middle schoolers proficient in math as of the last recorded state assessments.

    It is safe to say that in terms of achievement, that $4.77 million granted to Northwest Middle School in Kansas City, Kansas didn’t buy much. This is evidence that, once again, more money does not inherently make a difference in student outcomes. This nationwide study conducted by the Heritage Foundation supports that contention. Even Kansas’s own Legislative Post Audit says in this report (p. 107) that a correlation between increased funding and increased outcomes is inconclusive.

    As a 20-year teaching veteran, I know it’s not the money that makes a difference in student achievement. It’s commitment by students, parents, teachers, principals and administrators to make it happen. Trying to quantify that in dollar terms is a fool’s errand. If the increase in education funding prescribed in the most recent Gannon decision were to become a reality, it would mean a nice raise for teachers and likely more administrators, but student outcomes would remain flat and achievement gaps would continue. Think of it as Montoy redux.

    Clearly, the judges got it wrong. Let’s hope their decision gets overturned on appeal and an end is put to this seemingly endless carousel of education funding lawsuits. The citizens of Kansas deserve better.

  • The philosophy and research supporting at-risk funding

    From Kansas Policy Institute.

    The philosophy and research supporting at-risk funding –- second in a series
    By David Dorsey, Kansas Policy Institute

    As I discussed in the first blog in this series, the state of Kansas provides almost $400 million additionally each year for at-risk funding to K-12 education. But what is the philosophy behind spending more taxpayer dollars to educate economically disadvantaged students? What does the research say? And how have states responded in their particular “at-risk” funding formulas? In this blog I will briefly answer address these questions.

    It may sound like a dumb question, but why is it that it should cost more to adequately educate students who are disadvantaged? Sure, it seems intuitive, but where did that idea start and where is the research to back it up?

    The genesis of the premise that it costs more to adequately educate the economically disadvantaged comes from a 1969 article in theNational Tax Journal by three economists who attempted to explain why the cost of all local public services was outpacing inflation in post-World War II America. (Sidebar: their article is proof that the concern over rapidly expanding government spending is not a recent phenomenon.) The researchers suggested that differing costs for public service across jurisdictions could partially be explained by environmental factors. Specifically regarding education, they say that outcomes might be a function of “the ‘basic intelligence’ of pupils, home backgrounds and neighborhood conditions.” That seems to be the phrase subsequent researchers have locked onto to justify the need for what has become commonly known as at-risk funding.

    Many studies since then, including this 1997 study and this one from 2004, focused on spending disparities and “outcome” disparities among school districts within states. Again, without getting too “wonky,” studies showed school districts that were property poor, and as a parallel had lower per pupil spending (since school financing is primarily a function of property values), had lower outcomes than their counterparts with higher property values. And of course, those property poor districts had a disproportionate share of low income families/students. Therefore, the studies concluded that poor school districts needed more money to bring their students up to an acceptable minimum outcome standard. Researchers typically defined outcome as an index of a combination of standardized test scores and other indicators such as graduation rates.

    But these studies have remained academic exercises. Even though it is now a given that poor students require more money to reach a given outcome, most states now have some form of additional funding based on economic status of students. However, the amounts states have allocated are all less than the research concludes are necessary.

    Yes, politics and budget constraints trump academia.

    The Kansas At-Risk Timeline

    In 1992 a new law entitled the School District Finance and Quality Performance Act included a 5% weighting for students who qualified for free school lunch. That percentage was increased to 6.5% in 1997 and increased seven more times in the next decade to its current level of 45.6%. In 2006, two more categories of at risk were added. One was for schools with high percentages of at risk populations and/or an enrollment density of at least 212.1 students per square mile. The other additional category targeted money for students non-proficient in math and reading, but not eligible for a free lunch. (The non-proficient category was eliminated in 2014.) In dollar terms, the 5% in 1992 generated just over $13 million. That amount is now nearly $400 million.

    The situation in Kansas is not dissimilar to those in other states. At least 35 states have a mechanism for additional funding generated by economically disadvantaged students. Most of them use some variation of the number of students who qualify for free OR free or reduced lunches through the National School Lunch Program (NSLP). NSLP has been the choice because it is an expedient and convenient proxy for determining economically disadvantaged students since qualification for free/reduced lunches is predominantly income based. And like Kansas many have weight values that are not static. A 2004 study out of the University of Wisconsin reports that nationwide the weights range from 15% in Vermont to 62.5% in Illinois, while a presentation last year to the Nevada state legislature showed a low of 9.15% in New Mexico to 180.0% in Georgia. The thing to keep in mind here is that it is nearly impossible to compare Kansas to other states because not all states use the same definition of disadvantaged and some use multiple factors to determine additional spending.

    So how did Kansas go from a relatively modest 5% at-risk weighting in 1992 to a hefty 45.6% (with two additional categories) by 2006? That is the topic of the next blog.

    Next: The political history of at-risk funding in Kansas