For December 2020, total Kansas tax revenue was 1.8 percent greater than last December 2019. Over the six months of the current fiscal year, tax revenue is 16.6 percent higher than at the same point of the previous fiscal year.
Category: Kansas state government

Kansas tax revenue, November 2020
For November 2020, total Kansas tax revenue was 4.3 percent greater than last November. Over the five months of the current fiscal year, tax revenue rose by 20.6 percent.
Tax reports from the State of Kansas for November 2020 show tax revenues falling from the previous month, but higher than the same month last year, despite the effects of the response to the pandemic.
When reporting on Kansas tax collections, the comparison is usually made to the estimated collections. Those estimates were revised in April based on economic conditions affected by the response to the pandemic. To get a feel for the effects of the response to the pandemic, it is best to compare to the same month the prior year.
(The estimated revenue figures are still important because the state budget is based on them. If the actual revenue is much below the estimated revenue, there may not be enough income to pay expenses.)
For November 2020, individual income tax collections were $275,431,758, up 9.1 percent from last November. Retail sales tax collections rose by 0.1 percent to $201,705,376. Total tax collections were $556,754,532, up 4.3 percent from the same month last year. A nearby table summarizes.

For fiscal year 2021, which started on July 1, 2020, total tax collections are up by 20.6 percent over the same period of the previous fiscal year. A large reason for this is the change in tax deadlines from April to July, shifting much revenue from fiscal year 2020 to fiscal year 2021. That hasn’t always been explained, as I show in In Kansas, explanations for tax collections may vary.
As can be seen in a nearby table, tax revenue for fiscal year 2021 is $582,301,471 greater than at the same time in the previous fiscal year. Of this, $465,061,221, or 79.9 percent, is due to the increase in individual income tax revenue.

My report on tax revenue for April details some changes made by the estimating group.
My interactive visualization of Kansas tax revenue has been updated with October data. Click here to use it.
An example from the visualization illustrates the composition of Kansas tax revenue for the last year. Individual income tax accounted for 50.5 percent of revenue, and retail sales tax 31.5 percent. Together, this is 82.0 percent. Add compensating use tax of 7.0 percent and corporate income tax of 5.6 percent, and that is nearly all — 94.6 percent — of Kansas tax revenue.

Click for larger. 
Click for larger 
Kansas tax revenue, October 2020
For October 2020, total Kansas tax revenue was 7.9 percent greater than last October. Over the four months of the current fiscal year, tax revenue rose by 24.4 percent.
Tax reports from the State of Kansas for October 2020 show tax revenues falling from the previous month, but higher than the same month last year, despite the effects of the response to the pandemic.
When reporting on Kansas tax collections, the comparison is usually made to the estimated collections. Those estimates were revised in April based on economic conditions affected by the response to the pandemic. To get a feel for the effects of the response to the pandemic, it is best to compare to the same month the prior year.
(The estimated revenue figures are still important because the state budget is based on them. If the actual revenue is much below the estimated revenue, there may not be enough income to pay expenses.)
For October 2020, individual income tax collections were $283,620,667, up 9.1 percent from last October. Retail sales tax collections rose by 5.1 percent to $210,994,242. Total tax collections were $596,567,392, up 7.9 percent from the same month last year. A nearby table summarizes.
For fiscal year 2021, which started July 1, 2020, total tax collections are up by 24.4 percent over the same period of the previous fiscal year. A large reason for this is the change in tax deadlines from April to July, shifting much revenue from fiscal year 2020 to fiscal year 2021. That hasn’t always been explained, as I show in In Kansas, explanations for tax collections may vary.

My report on tax revenue for April details some changes made by the estimating group.
My interactive visualization of Kansas tax revenue has been updated with October data. Click here to use it.

Example from the visualization. Click for larger. 
Local government employment in Kansas
Kansas has nearly the highest number of local government employees per resident, compared to other states.
These are local government employees only. State and federal government employees are not included. The source of this data is the United States Census Bureau. I’ve gathered it and created an interactive visualization. Additionally, using each state’s population for each year, I’ve also computed the annual payroll on a per-resident basis and the number of full-time equivalent (FTE) employees per thousand residents.
For all local government employees, Kansas had 50.55 employees per thousand residents in 2016, higher than all states (and areas) but the District of Columbia and Wyoming. These employees had an annual payroll of $2,355.09 per resident. Eleven states were higher.
For the country as a whole, the values are 37.33 employees and annual payroll of $2,232.01 per thousand residents.
Considering elementary and secondary education, Kansas had 29.58 such employees per thousand residents. This was higher than all states but Wyoming. The payroll for these employees was $1,237.80 per resident, with thirteen states above Kansas.
Kansas is a small state in terms of population. Might small states have higher needs for employees on a per-resident basis? A plot of employees vs. population shows nearly no relationship between the two. Plots using urban percentage and population density show somewhat stronger relationships, but nothing very significant. (In these plots, I removed the District of Columbia from the data, as it is a special case that is all urbanized.)
Click charts for larger versions.

These are local government employees only. State and federal government employees are not included. Sometimes this causes discrepancies that need to be understood by considering other data. For example, Hawaii has no local employees in elementary and secondary education, as it has one school district which is run by the state. 1 Because education is a large expense for local governments (in most cases), Hawaii, in these charts, ranks as the state with the lowest number of government employees, considering only local government employees.
Click here to learn about the visualization and use it to make your own charts and tables.

Example from the visualization. Click for larger. 
Example from the visualization. Click for larger. — Notes
- Wikipedia. Hawai’i Department of Education. Available at https://en.wikipedia.org/wiki/Hawai%27i_Department_of_Education. ↩

Kansas government employment and payroll by function
Looking at the number of state government employees in proportion to population, Kansas has many compared to other states.
Each year the United States Census Bureau surveys federal, state, and local government civilian employees. I’ve gathered this data and present it in an interactive visualization using several views and supplementary calculations.
The Census Bureau collects both counts of employees and payroll dollars. Comparisons based on the number of employees are useful, bypassing issues such as differing costs of living and salaries in general.
Considering all government functions and state government employees only, Kansas had 18.7 full-time equivalent (FTE) employees per thousand residents in 2019. 12 states had more. These figures are for state government only. Many government employees are employed by local governments such as cities, counties, and school districts. These employees are not included in this visualization.
In the nearby chart showing Kansas and nearby states, the level of employment in Kansas is high and rising for total employment and education employment.

Click for larger For details and to access the visualization, click on: Visualization: State government employment by state and function.

Kansas tax revenue, September 2020
For September 2020, total Kansas tax revenue fell by 2.0 percent from last September. Over the three months of the current fiscal year, tax revenue rose by 29.7 percent.
Tax reports from the State of Kansas for September 2020 show tax revenues falling from the previous month, and still recovering from the effects of the response to the pandemic.
When reporting on Kansas tax collections, the comparison is usually made to the estimated collections. Those estimates were revised in April based on economic conditions affected by the response to the pandemic. To get a feel for the effects of the response to the pandemic, it is best to compare to the same month the prior year.
For September 2020, individual income tax collections were $358,607,241, down 4.4 percent from last September. Retail sales tax collections fell by 2.5 percent to $195,565,714. Total tax collections were $728,892,761, down 2.0 percent from the same month last year. A nearby table summarizes.

For fiscal year 2021, which started July 1, 2020, total tax collections are up by 29.7 percent over the same period of the previous fiscal year. The press release from the governor’s office noted that the change in tax deadlines is part of the reason for the increase. That hasn’t always been explained, as I show in In Kansas, explanations for tax collections may vary.

My report on tax revenue for April details some changes made by the estimating group.
My interactive visualization of Kansas tax revenue has been updated with August data. Click here to use it.

In Kansas, explanations for tax collections may vary
Kansas officials have explanations for low tax collections, but don’t mention the same contributing factor when touting high collections.
In March, Kansas Governor Laura Kelly, in response to the COVID-10 pandemic, delayed the due date for Kansans to file and pay income taxes from April 15, 2020 to July 15, 2020. 1 This change was bound to affect state tax collections for April, and it did.
When presenting tax collections for the month of April 2020, the Department of Revenue explained: “As predicted, the State of Kansas saw a decrease in total tax collections when compared to April of Fiscal Year 2019. These reductions are largely due to announced tax date extensions, which gave relief to Kansans while moving collections into the Fiscal Year 2021.” 2
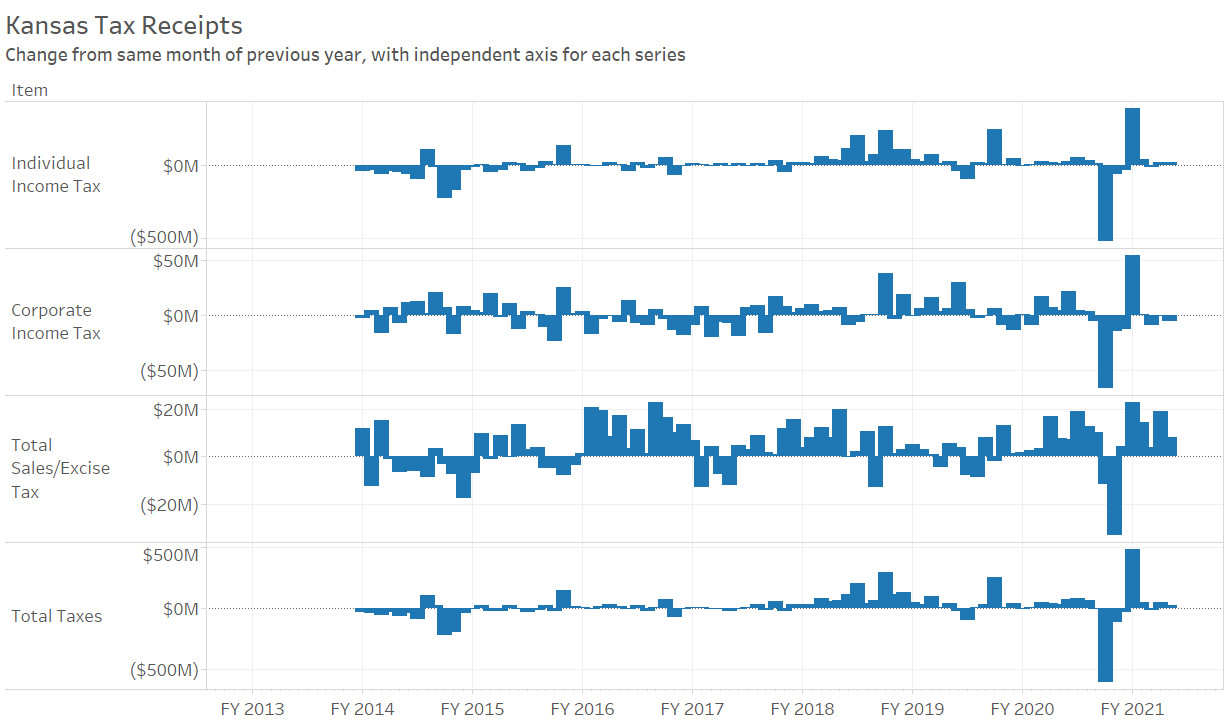
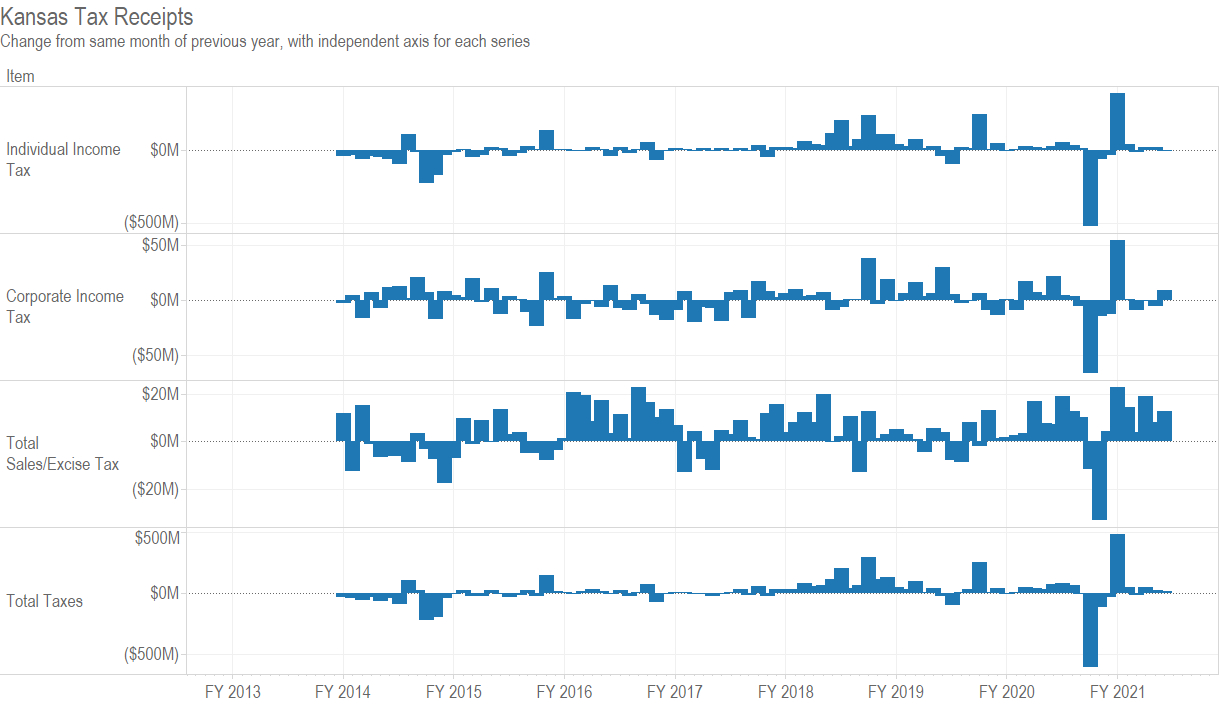
Specifically, individual income tax revenue for April 2020 fell by $526 million (65.0 percent) from April 2019. 3 Corporate income tax collections also fell, but caused a much smaller effect. (Over the past five years, individual income tax collections have accounted for about 45.0 percent of total tax collections, while corporate income tax was 6.7 percent of the total.)
For Kansas state government, the fiscal year starts on July 1, and is named for the calendar year in which it ends. Fiscal year 2020, for example, began on July 1, 2019, and ended on June 30, 2020. So not only was a lot of collections shifted from one month to another, the shift also crossed the fiscal year boundary.
When July 2020 tax collections were released, the governor’s office commented:
The State of Kansas starts Fiscal Year 2021 by surpassing its total tax-only collections by $484.6 million compared to July of last fiscal year. …
The State collected $619.6 million in individual income taxes for the month; an increase of $395.3 million, or 176.3%, compared to the July of Fiscal Year 2020. However, these collections were $30.4 million, or 4.7%, less than the estimate for the month. Corporate income tax collections were $69.8 million; $5.2 million, or 6.9%, less than estimated but an increase of $54.6 million compared to July of FY 2020. [Kansas Governor’s office news release, August 4, 2020. Available at https://governor.kansas.gov/kansas-total-tax-collections-484-6-million-ahead-of-july-of-last-fiscal-year/.]
Note there is no mention of why the July income taxes were so much higher than last July. While I have presented only an excerpt of the news release, the remainder does not mention the shift of tax deadlines as the reason for the increase.
When announcing August 2020 tax collections, the governor released this, in part:
The state is $35.6 million, or 2.4%, ahead of projections for the year with $1.5 billion in total tax collections for the fiscal year. When comparing total tax collections over the same timeframe to the previous fiscal year, the State of Kansas is $531.0 million, or 53.5%, ahead of Fiscal Year 2020. [Kansas Governor’s office news release, September 1, 2020. Available at https://governor.kansas.gov/state-of-kansas-tax-collections-40-2-million-above-estimates/.]
Here, the press release touts large revenue growth for the fiscal year. But only two months of the fiscal year have passed, and for one of these, collections benefitted mightily from the shift of tax deadlines. The news release did not mention this as a factor in the fiscal year’s increase in tax collections compared to the previous year.
It is not the case that the governor and state officials are not aware of the effect of shifting tax deadlines on revenue. The governor mentioned the shift in April to explain low collections.
But there was no mention of the same factor when celebrating high collections.
I asked the governor’s office and the Department of Revenue to explain this, but there was no response. Michael Austin, who is Director of the Sandlian Center for Entrepreneurial Government at Kansas Policy Institute, said: “Unfortunately it’s another example the administration is more focused on hiding bad press, than to simply present Kansans with facts and reasonable analysis. With July and August income tax revenues offsetting last year’s decline, it’s clear the tax extension moved revenues from April to July and August.”
The example Austin referred to concerns a chart of COVID-19 data that was presented in an unorthodox manner that bolstered the administration’s positions.
For more on Kansas tax collections, see Kansas tax revenue, August 2020 and my interactive visualization of Kansas tax revenue.
—
Notes- Executive order 20-13. Available at https://governor.kansas.gov/wp-content/uploads/2020/03/EO-20-13-Executed.pdf. ↩
- Kansas Department of Revenue news release, May 1, 2020. Available at https://www.ksrevenue.org/press/2020/pr05012020.html. ↩
- Weeks, Bob. Kansas tax revenue experiences effects of pandemic response. Available at https://wichitaliberty.org/kansas-government/kansas-tax-revenue-experiences-effects-of-pandemic-response/. ↩

Kansas general fund spending and receipts
The Kansas budget is volatile, with rising spending and a large deficit.
Figures from Kansas financial reports show that state spending has risen. Based on that and shifts in revenue flows, deficits are large.
The following tables and charts show actual data through fiscal year 2019. Figures for 2020 are revised estimates, and for 2021, the figures are from the approved budget. The primary source of data is Kansas Comparison Report: The FY 2021 Governor’s Budget Report with Legislative Authorizations. 1
The revised estimate of receipts is $826.9 million less than the estimate from November 2019. The revision takes into account estimates of the effect of the pandemic, while the November estimate was made before the coronavirus was known, at least in the United States.
A large reason for the reduction in estimates of receipts is a change in tax due date: “The individual income tax estimate was decreased by $620.0 million in FY 2020 based on the deferment of $560.0 million in tax year 2019 balance dues and estimated payments that now will not be paid until July 15, 2020.” That effect was noticed in July, when individual income tax receipts were $395.3 million higher than in July 2019. 2
Because of the deferral of so much tax revenue from fiscal years 2020 to 2021, receipts in 2021 are forecast to rise by 5.9 percent.
In the following table, spending increases from the general fund average 4.0 percent per year for 2011 through 2021. For the same period, revenue increases average 3.3 percent.
The deficit of revenue compared to spending in 2020 is slightly over one billion dollars. The state issued a certificate of indebtedness of $900.0 million to compensate. This is a loan that must be repaid by the end of fiscal 2021, which is June 30, 2021.
Click on charts and tables for larger versions.


—
Notes- Kansas Division of the Budget, Kansas Comparison Reports. Available at https://budget.kansas.gov/comparison-reports/. ↩
- Weeks, Bob. Kansas tax revenue, July 2020. Available at https://wichitaliberty.org/kansas-government/kansas-tax-revenue-2020-07/. ↩

Kansas spending
Kansas governmental spending from several perspectives.
Here are charts of government spending in Kansas. The source of the spending data is Kansas Fiscal Facts 2020 and earlier versions. This is published by Kansas Legislative Research Department, the nonpartisan research arm of the legislature.
Figures for 2019 and earlier are actual values, while 2020 and 2021 are approved figures. For 2020 and beyond, the population, GDP, personal income, and consumer price index figures are my estimates.
Values have been adjusted using CPI to 2019 dollars.
The general fund is, according to the state: “The primary operating fund of the State. It accounts for all financial resources of the State except those required to be accounted for in another fund. The state general fund is primarily supported by tax revenue.” It is the fund over which the governor and legislature have the most control.
Click charts for possible larger versions.