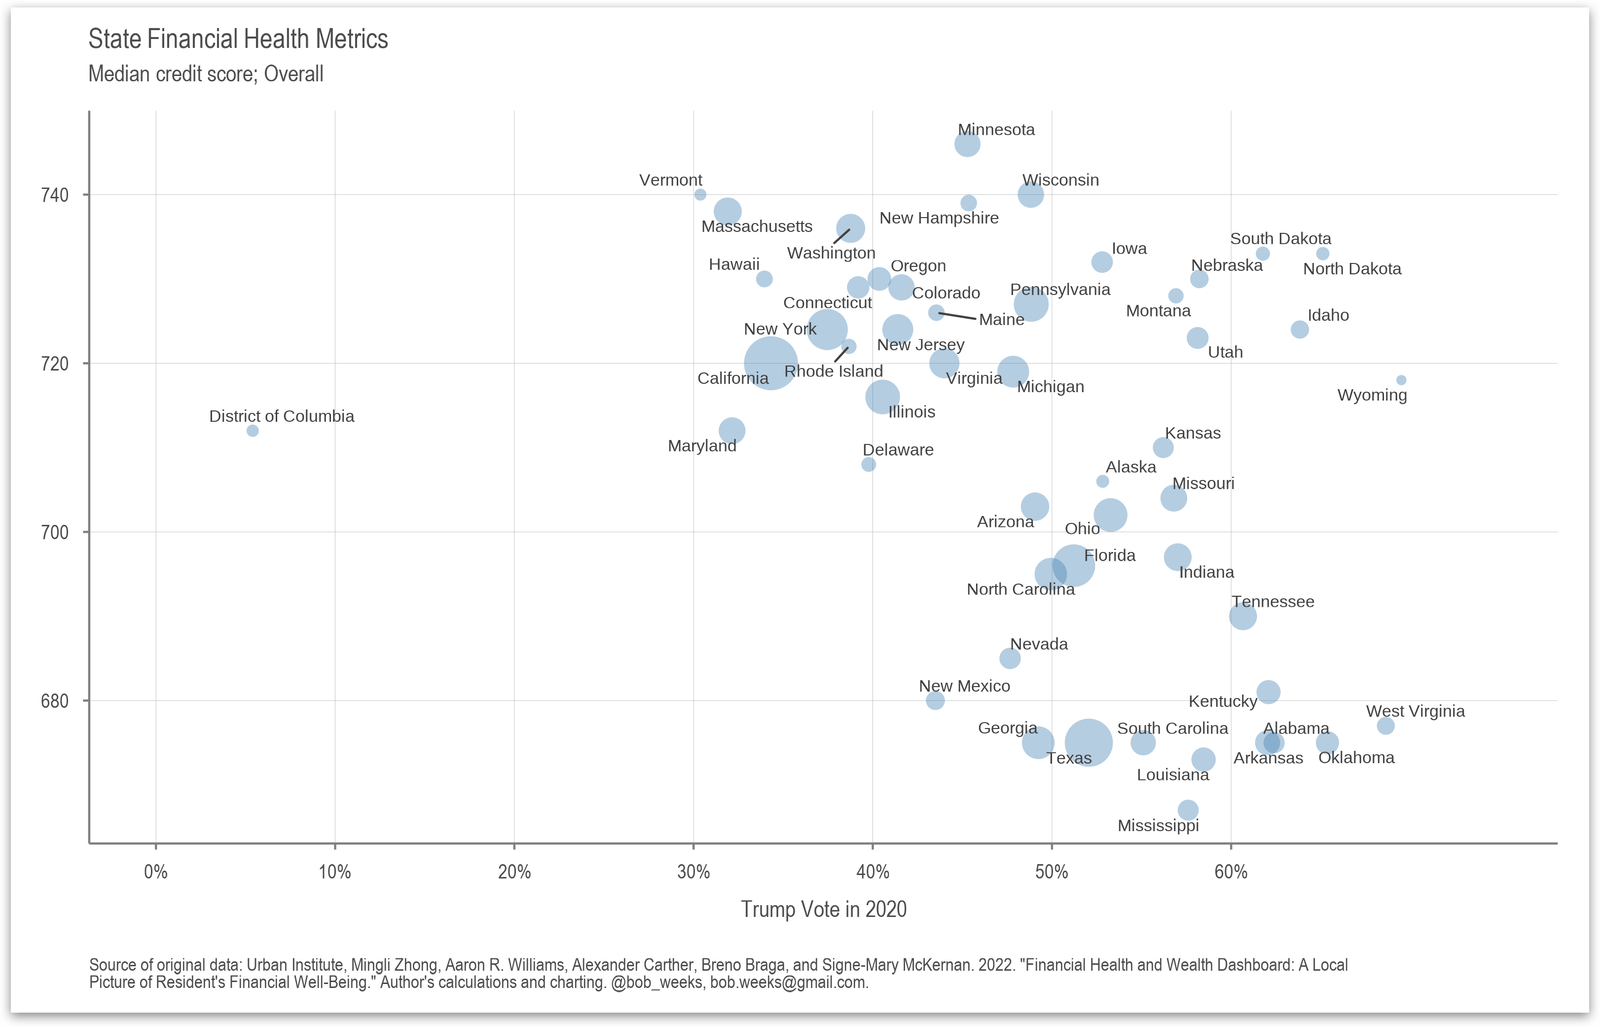

This chart shows the relationship between the median credit scores of residents in each U.S. state and the percentage of votes that Donald Trump received in the 2020 election.
Here’s a simple breakdown:
- Horizontal Axis (X-axis): Represents the percentage of votes that Donald Trump received in each state in the 2020 election.
- Vertical Axis (Y-axis): Represents the median credit score of residents in each state.
- Bubbles: Each bubble represents a state. The size of the bubble may indicate additional data points, such as population size, though this is not explicitly explained in the chart.
Key Observations:
- Higher Credit Scores in Blue States: States where Trump received a lower percentage of the vote tend to have higher median credit scores. For example, states like Vermont, Massachusetts, and New York have high credit scores and low Trump vote percentages.
- Lower Credit Scores in Red States: States where Trump received a higher percentage of the vote tend to have lower median credit scores. States like Mississippi, West Virginia, and Alabama have low credit scores and high Trump vote percentages.
- Outliers: The District of Columbia has a relatively low Trump vote percentage and a median credit score slightly below 720, standing out from other states.
Overall, the chart suggests a correlation between higher credit scores and states that voted less for Trump in the 2020 election, and lower credit scores in states that voted more for Trump.