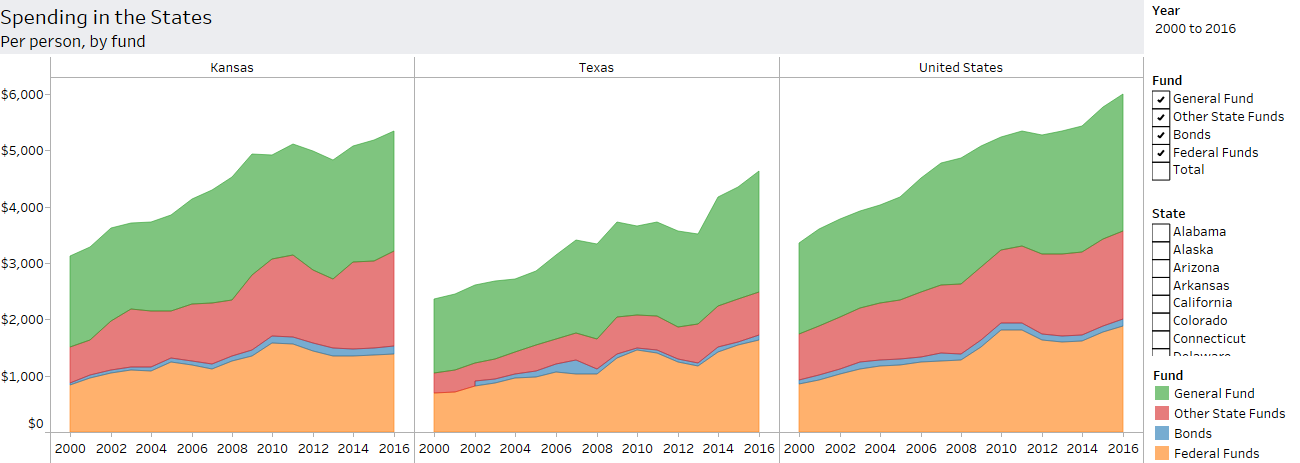
The National Association of State Budget Officers publishes spending data for the states. In this interactive visualization, I present the data in a graphical and flexible format.
Data for each state is subdivided by fund (see below for definitions). Data through 2015 is actual, while data for fiscal year 2016 is estimated. The figures for the state “United States” were computed by summing the spending in all states, then dividing by the U.S. population. These figures are not adjusted for inflation.
Of note is the tab comparing spending in states that have an income tax vs. those that have no income tax.
Click here to access the visualization.

From NASBO, definitions of the funds.
General Fund: The predominant fund for financing a state’s operations. Revenues are received from broad-based state taxes. However, there are differences in how specific functions are financed from state to state.
Federal Funds: Funds received directly from the federal government.
Other State Funds: Expenditures from revenue sources that are restricted by law for particular governmental functions or activities. For example, a gasoline tax dedicated to a highway trust fund would appear in the “Other State Funds” column. For higher education, other state funds can include tuition and fees. For Medicaid, other state funds include provider taxes, fees, donations, assessments, and local funds.
Bonds: Expenditures from the sale of bonds, generally for capital projects.
State Funds: General funds plus other state fund spending, excluding state spending from bonds.
Leave a Reply